www.Mybricks.it

www.Mybricks.it
DESIGNERLEONIDASIMMENSO


www.Mybricks.it
www.Mybricks.it
DESIGNERLEONIDASIMMENSO

LEGO BAM Build a Minifigure – Christmas 2025 – Released on November 2025

LEGO BAM Build a Minifigure – 2025 Q6 – Released on October 2025

LEGO BAM Build a Minifigure – 2025 Halloween – Released on September 2025 and more 2 on October 2025

LEGO BAM Build a Minifigure – 2025 Q5 – Released on July 2025

LEGO BAM Build a Minifigure – 2025 Q4 – Released on june 2025

LEGO BAM Build a Minifigure – 2025 Q3
1st April 2025

LEGO BAM Build a Minifigure – 2025 Q2
February 2025

Lego 71048 – Minifigures Series 27 – January 2025

LEGO BAM Build a Minifigure – 2025 Q1
January 2025 – Snake Chinese Year

LEGO BAM Build a Minifigure – Christmas 2024

LEGO BAM – Build a Minifigure – Halloween 2023 – Released on 1st september 2024 in UK

LEGO BAM Build a Minifigure – 2024 Q5 – 1st September 2024

See more on www.digiluna.com

www.digiluna.com

LEGO BAM Build a Minifigure – 2024 Q4 – 4th July 2024

Lego 71045 – Minifigures Series 25 – May 2024

LEGO BAM Build a Minifigure – 2024 Q3 Released on 5th May 2024


Minecraft babies minifigures


LEGO BAM Build a Minifigure – 2024 Q2 – (released on 2nd February 2024):
Six new BAM minifigures, included 3 BAM ‘CAKE PARTY’:

LEGO BAM Build a Minifigure – 2024 Q1 – January 2024 – Dragoon Chinese Year

Lego 71045 – Minifigures Series 25 – 1st January 2024


LEGO BAM Build a Minifigure – Christmas 2023

The Big Shop – Legoland Orlando shopper card
The Big Shop – Legoland Orlando shopper card 128$ is not refundable if not returned within 1 hour from its emission.

LEGO BAM Build a Minifigure – 2023 Q4 – October 2023

LEGO BAM – Build a Minifigure – Halloween 2023


LEGO BAM Build a Minifigure – 2023 Q3 – Release date 1st June 2023
LEGO BAM Build a Minifigure – 2023 Q3


On 1st June 2023 will be available the Lego set 40649. I am happy for the new giant Lego minifigure!
It pairs great to my Lego ideas project…
https://ideas.lego.com/projects/7e3ff4b5-313e-4013-a0e1-e5c0f97e312d
Sorry that this has run out of time!


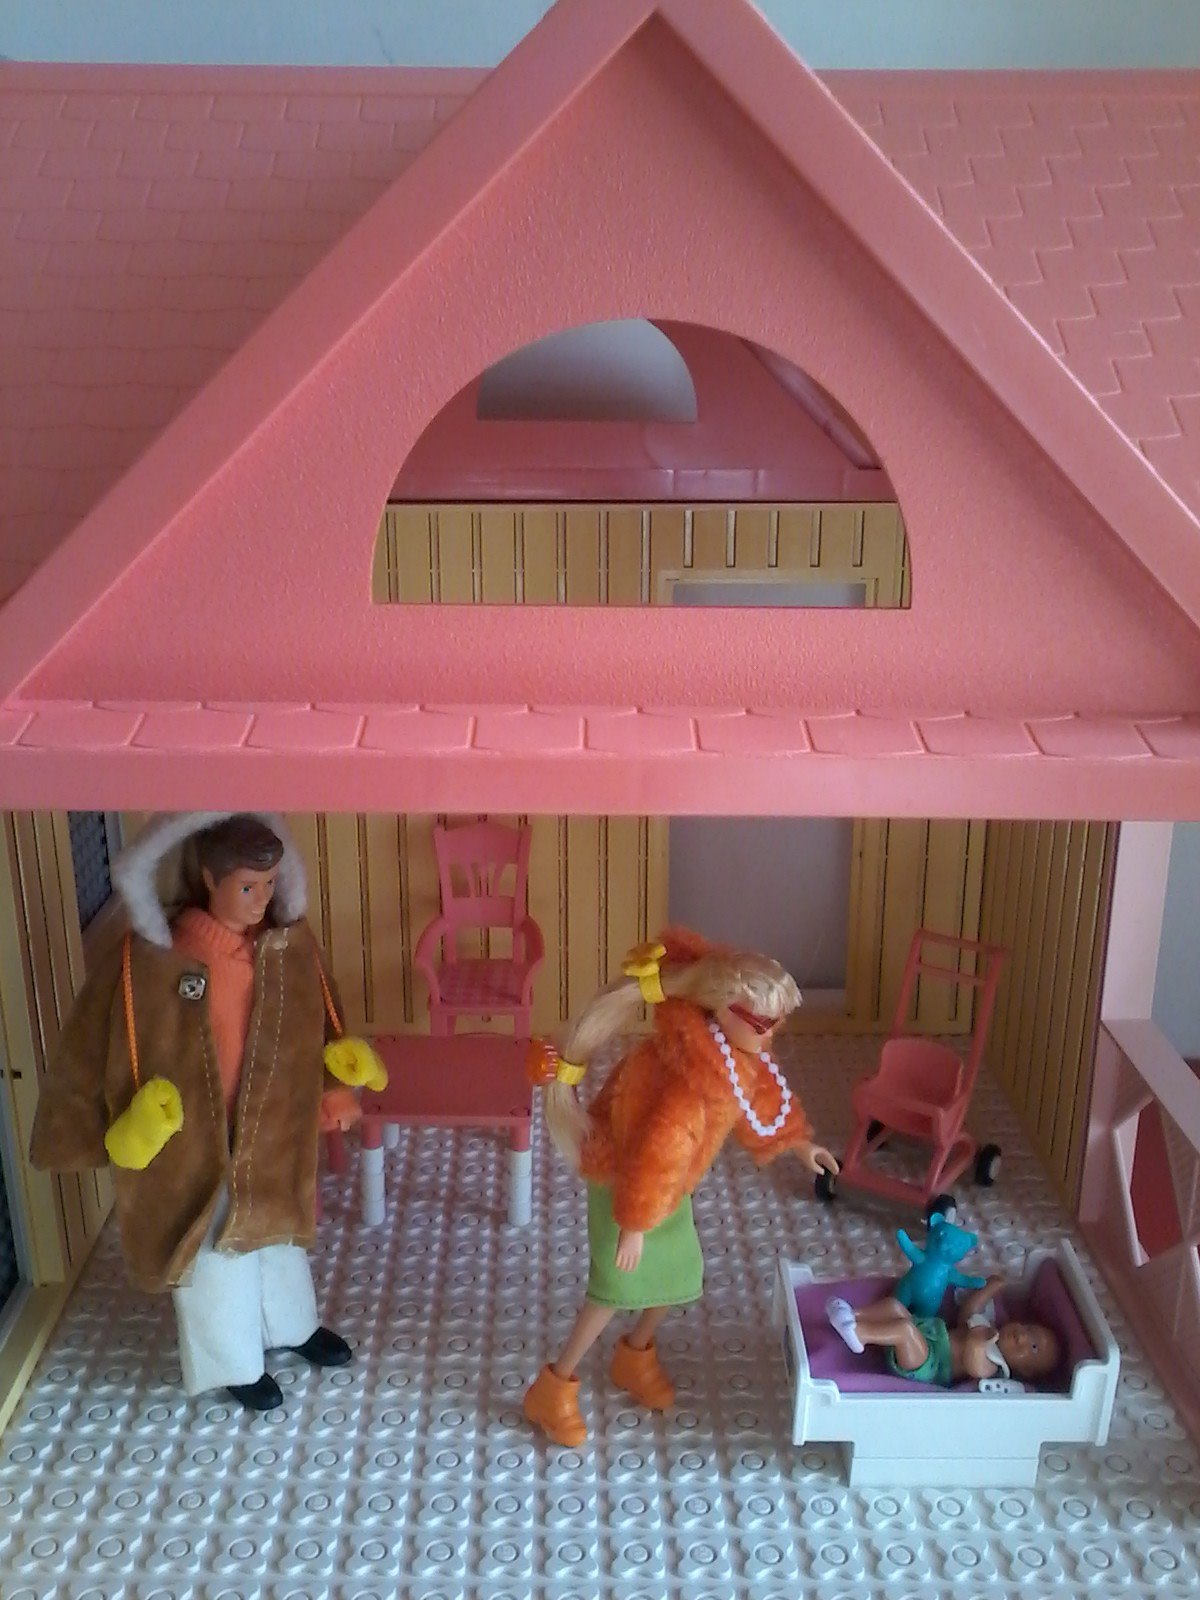
Lego 4161 Freestyle – Family with stroller – Lego 1995


Lego 345 Basic – Family with stroller – Lego 1993


Very nice set. Not easy to be built because it is difficult to follow instruction-sheet.


LEGO BAM Factory – Build a Minifigure – TUTORIAL
Step 1: Place under the small empty box that you pay at cash desk
Step 2: Select the language and choose the title for your BAM
Step 3: Torso pattern selection

Step 4: Painter function

Step 5: Decoration function

Step 6: Typer function

Step 7: Final check

Step 8: Choose from the BAM kiosk your BAM legs, head, hair and one accessory to complete your special minifigure!


LEGO BAM Build a Minifigure – Christmas 2022


LEGO BAM Build a Minifigure – 2022 Q4


All pieces come from ordinal Lego sets

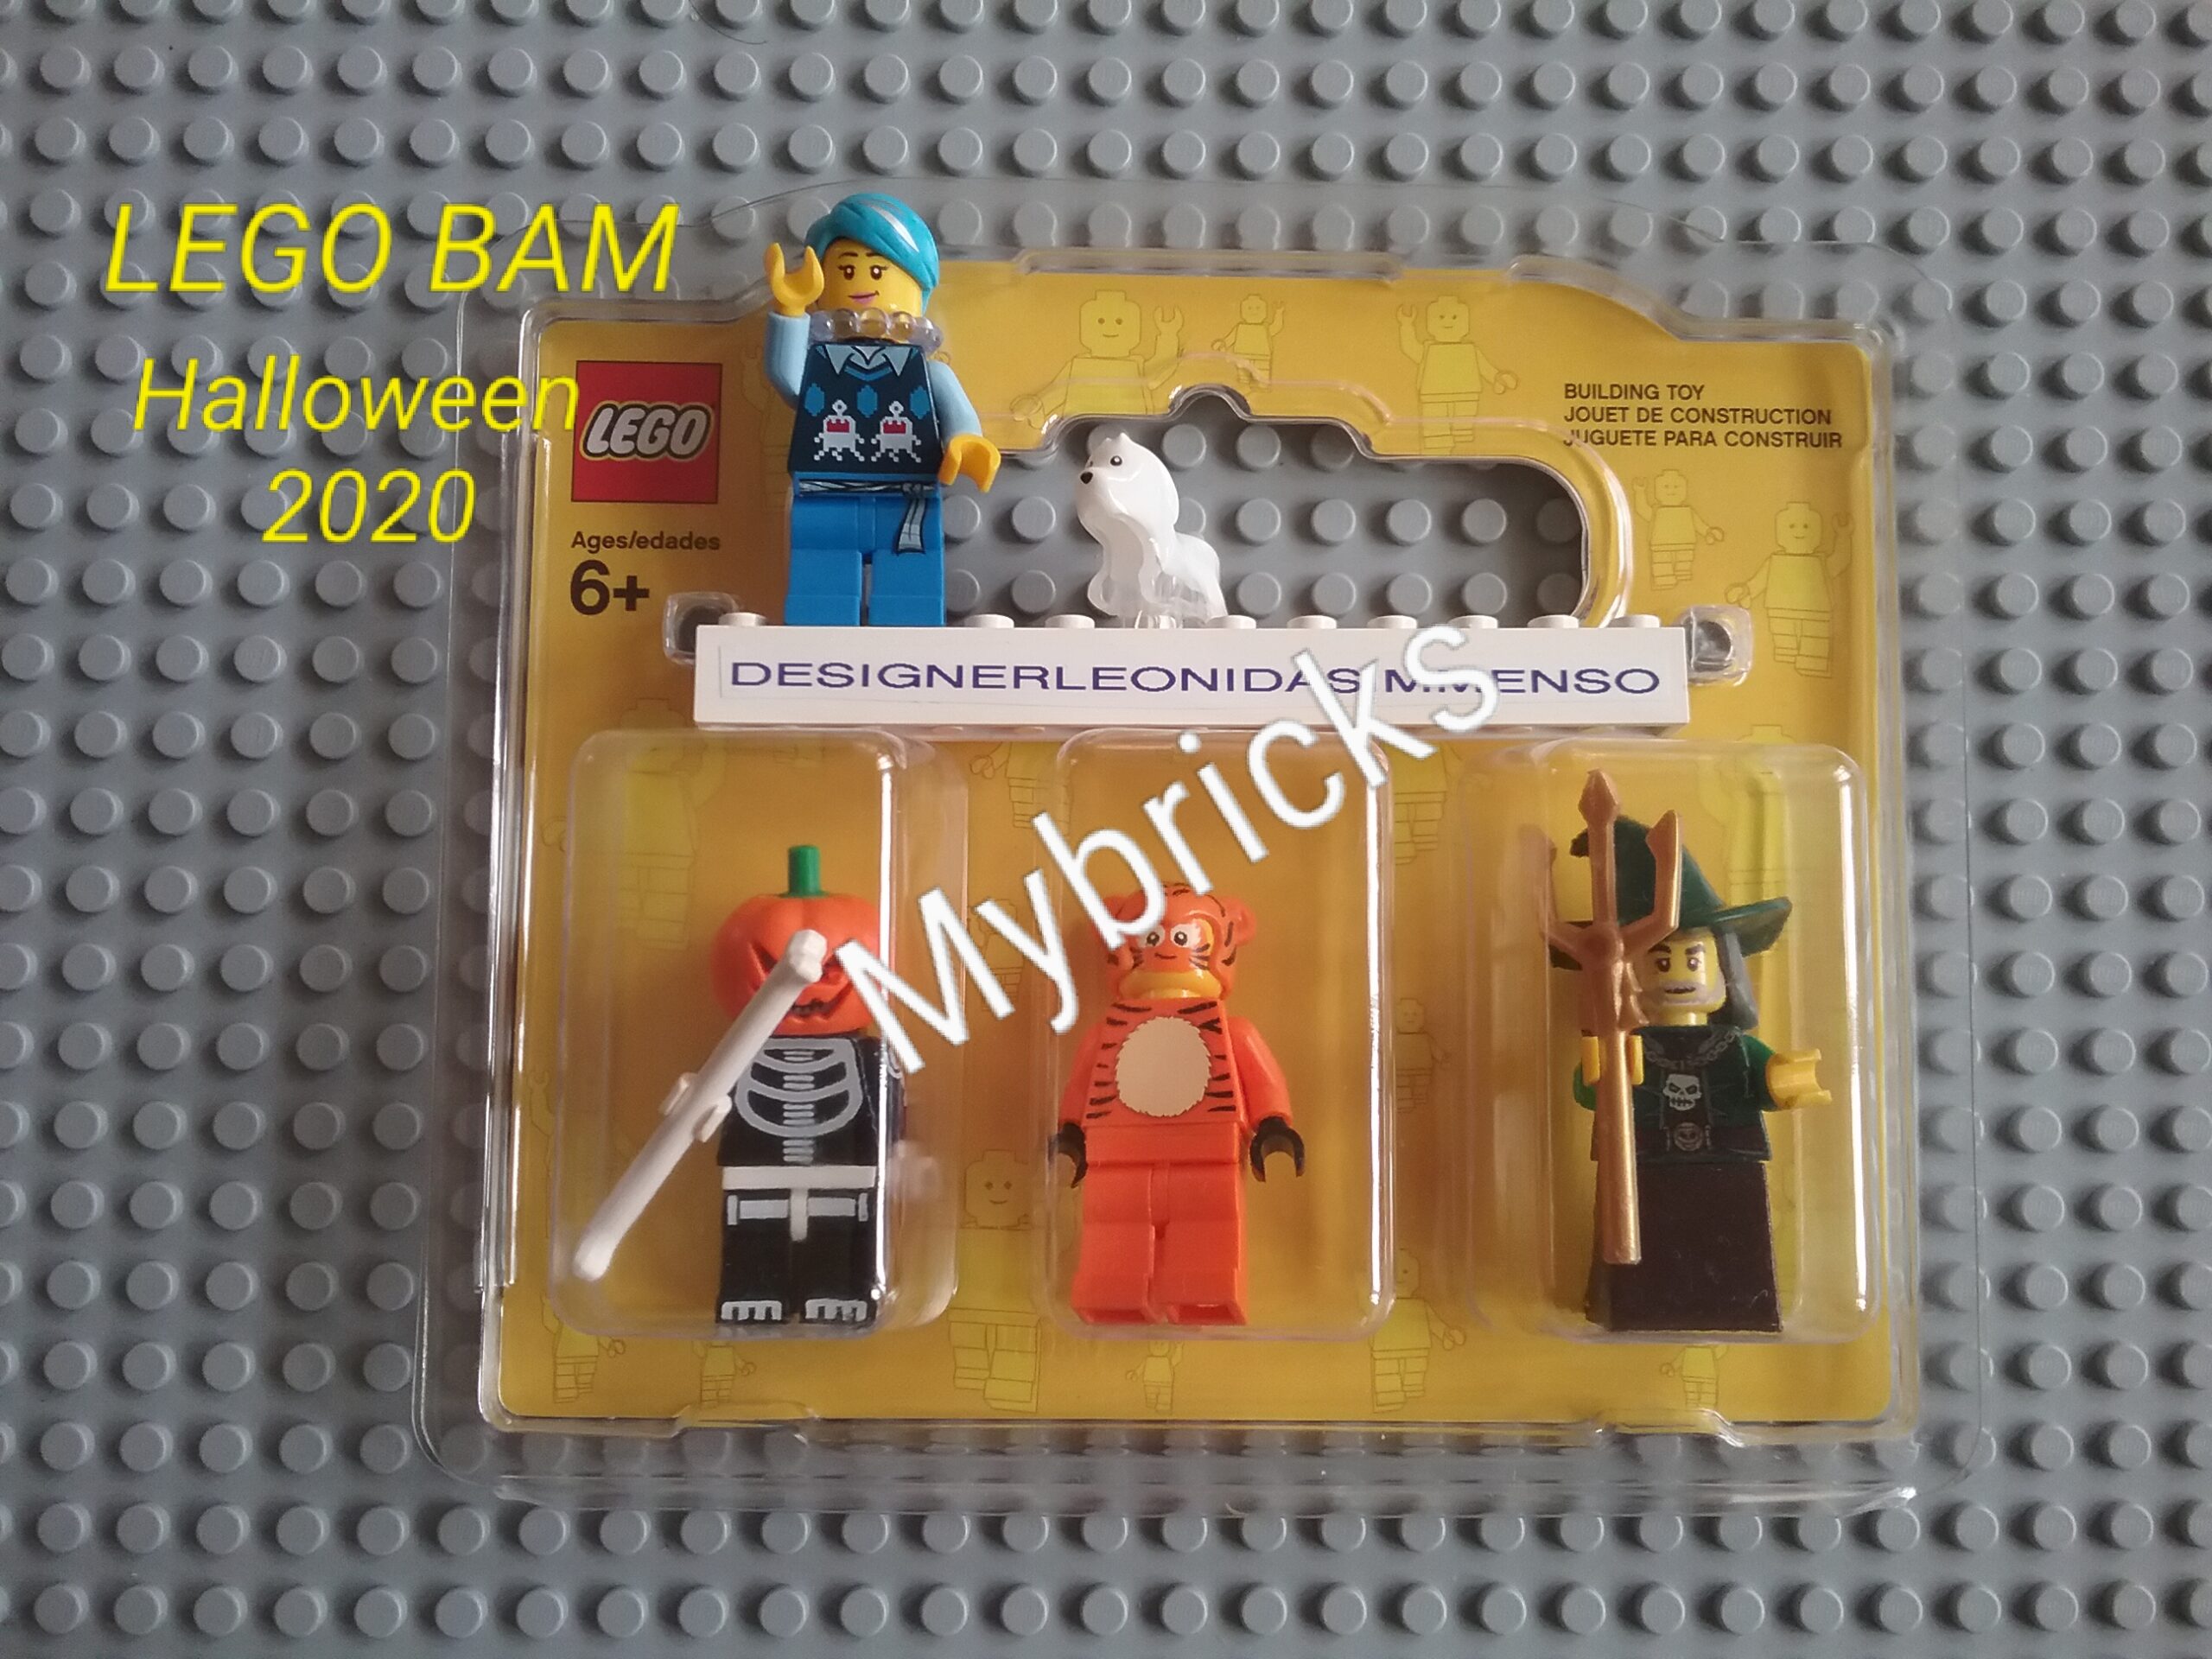
LEGO BAM Build a Minifigure – Halloween 2020
Black skeleton coming from minifigure collectible Series 16 (Minifigure #11)


LEGO BAM Build a Minifigure – 2020 Q1
BAM Special minifigure for the Chinese 2020 year ‘Mouse Year’
BAM Special minifigure ‘Leonardo da Vinci Celebration’

LEGO BAM Build a Minifigure – Halloween 2019
Ordinal witch in series 14 (Minifigure #4)
Torso with skull coming from Series 16 (Minifigure #5)


LEGO BAM Special – Build a Minifigure – Halloween 2018
Ordinal Witch in Series 14 (minifigure #4)
Ordinal Vampire in Series 2 (minifigure #5)
Ordinal Spider Witch in Series 14 (minifigure #16)


From the end of January 2022 the trend of the curves is downward and on March 31, 2022 the state of emergency in Italy ended.
Until April 30, 2022, the restrictions for children over 12 have been extended, who will have to wait until May 1, 2022 to start playing sports again, if they do not have the so-called ‘reinforced green pass’ obtainable with the vaccine or covid healed from 6 months, or exemption.
Dal 25 gennaio 2022 l’andamento delle curve è in discesa e il 31 marzo 2022 in Italia é terminato lo stato di emergenza.
Fino al 30 aprile 2022 sono state prorogate le restrizioni per i bambini sopra i 12 anni, che dovranno attendere il 1 maggio 2022 per ricominciare a fare sport, se non sono in possesso del cosiddetto ‘green pass rafforzato’ ottenibile col vaccino o guarigione da meno di 6 mesi o l’esenzione.

From monday 21st march Italy will be ‘White’ with the only exception of Sardinia (Yellow)
Da domani, lunedì 21 marzo tutta l’Italia diventa ‘bianca’ con l’unica eccezione della Sardegna che resta gialla.

The curves are both going down. The media report that the positivity index (obtained from the percentage of positives on the number of tampons made) increases.
Le curve stanno entrambe scendendo. I media comunicano che l’indice di positività (ricavato dalla percentuale dei positivi sul numero dei tamponi fatti) e’ alto.


In the white area: Basilicata, Molise and Umbria.
In the yellow zone: Calabria, Campania, Emilia Romagna, Lazio, Liguria, Lombardy, Marche, PA Bolzano, PA Trento, Puglia, Sardinia, Tuscany and Veneto.
In the orange zone: Abruzzo, Friuli Venezia Giulia, Piedmont, Sicily and Valle Aosta.
The national competitions over 14 scheduled for 11-13 February 2022 in Verona, Bastia Umbra and Bolzano reserved only for vaccinated immune for 6 months fencers and unvaccinated fencers not immune but exempt with green pass have been confirmed.
In zona bianca: Basilicata, Molise e Umbria.
In zona gialla: Calabria, Campania, Emilia Romagna, Lazio, Liguria, Lombardia, Marche, PA Bolzano, PA Trento, Puglia, Sardegna, Toscana e Veneto.
In zona arancione: Abruzzo, Friuli Venezia Giulia, Piemonte, Sicilia e Valle Aosta
Confermate le gare nazionali over 14 previste per l’11-13 Febbraio 2022 a Verona, Bastia Umbra e Bolzano riservate a soli schermidori vaccinati immuni da 6 mesi con green pass e non vaccinati esenti non immuni, ma con green pass.

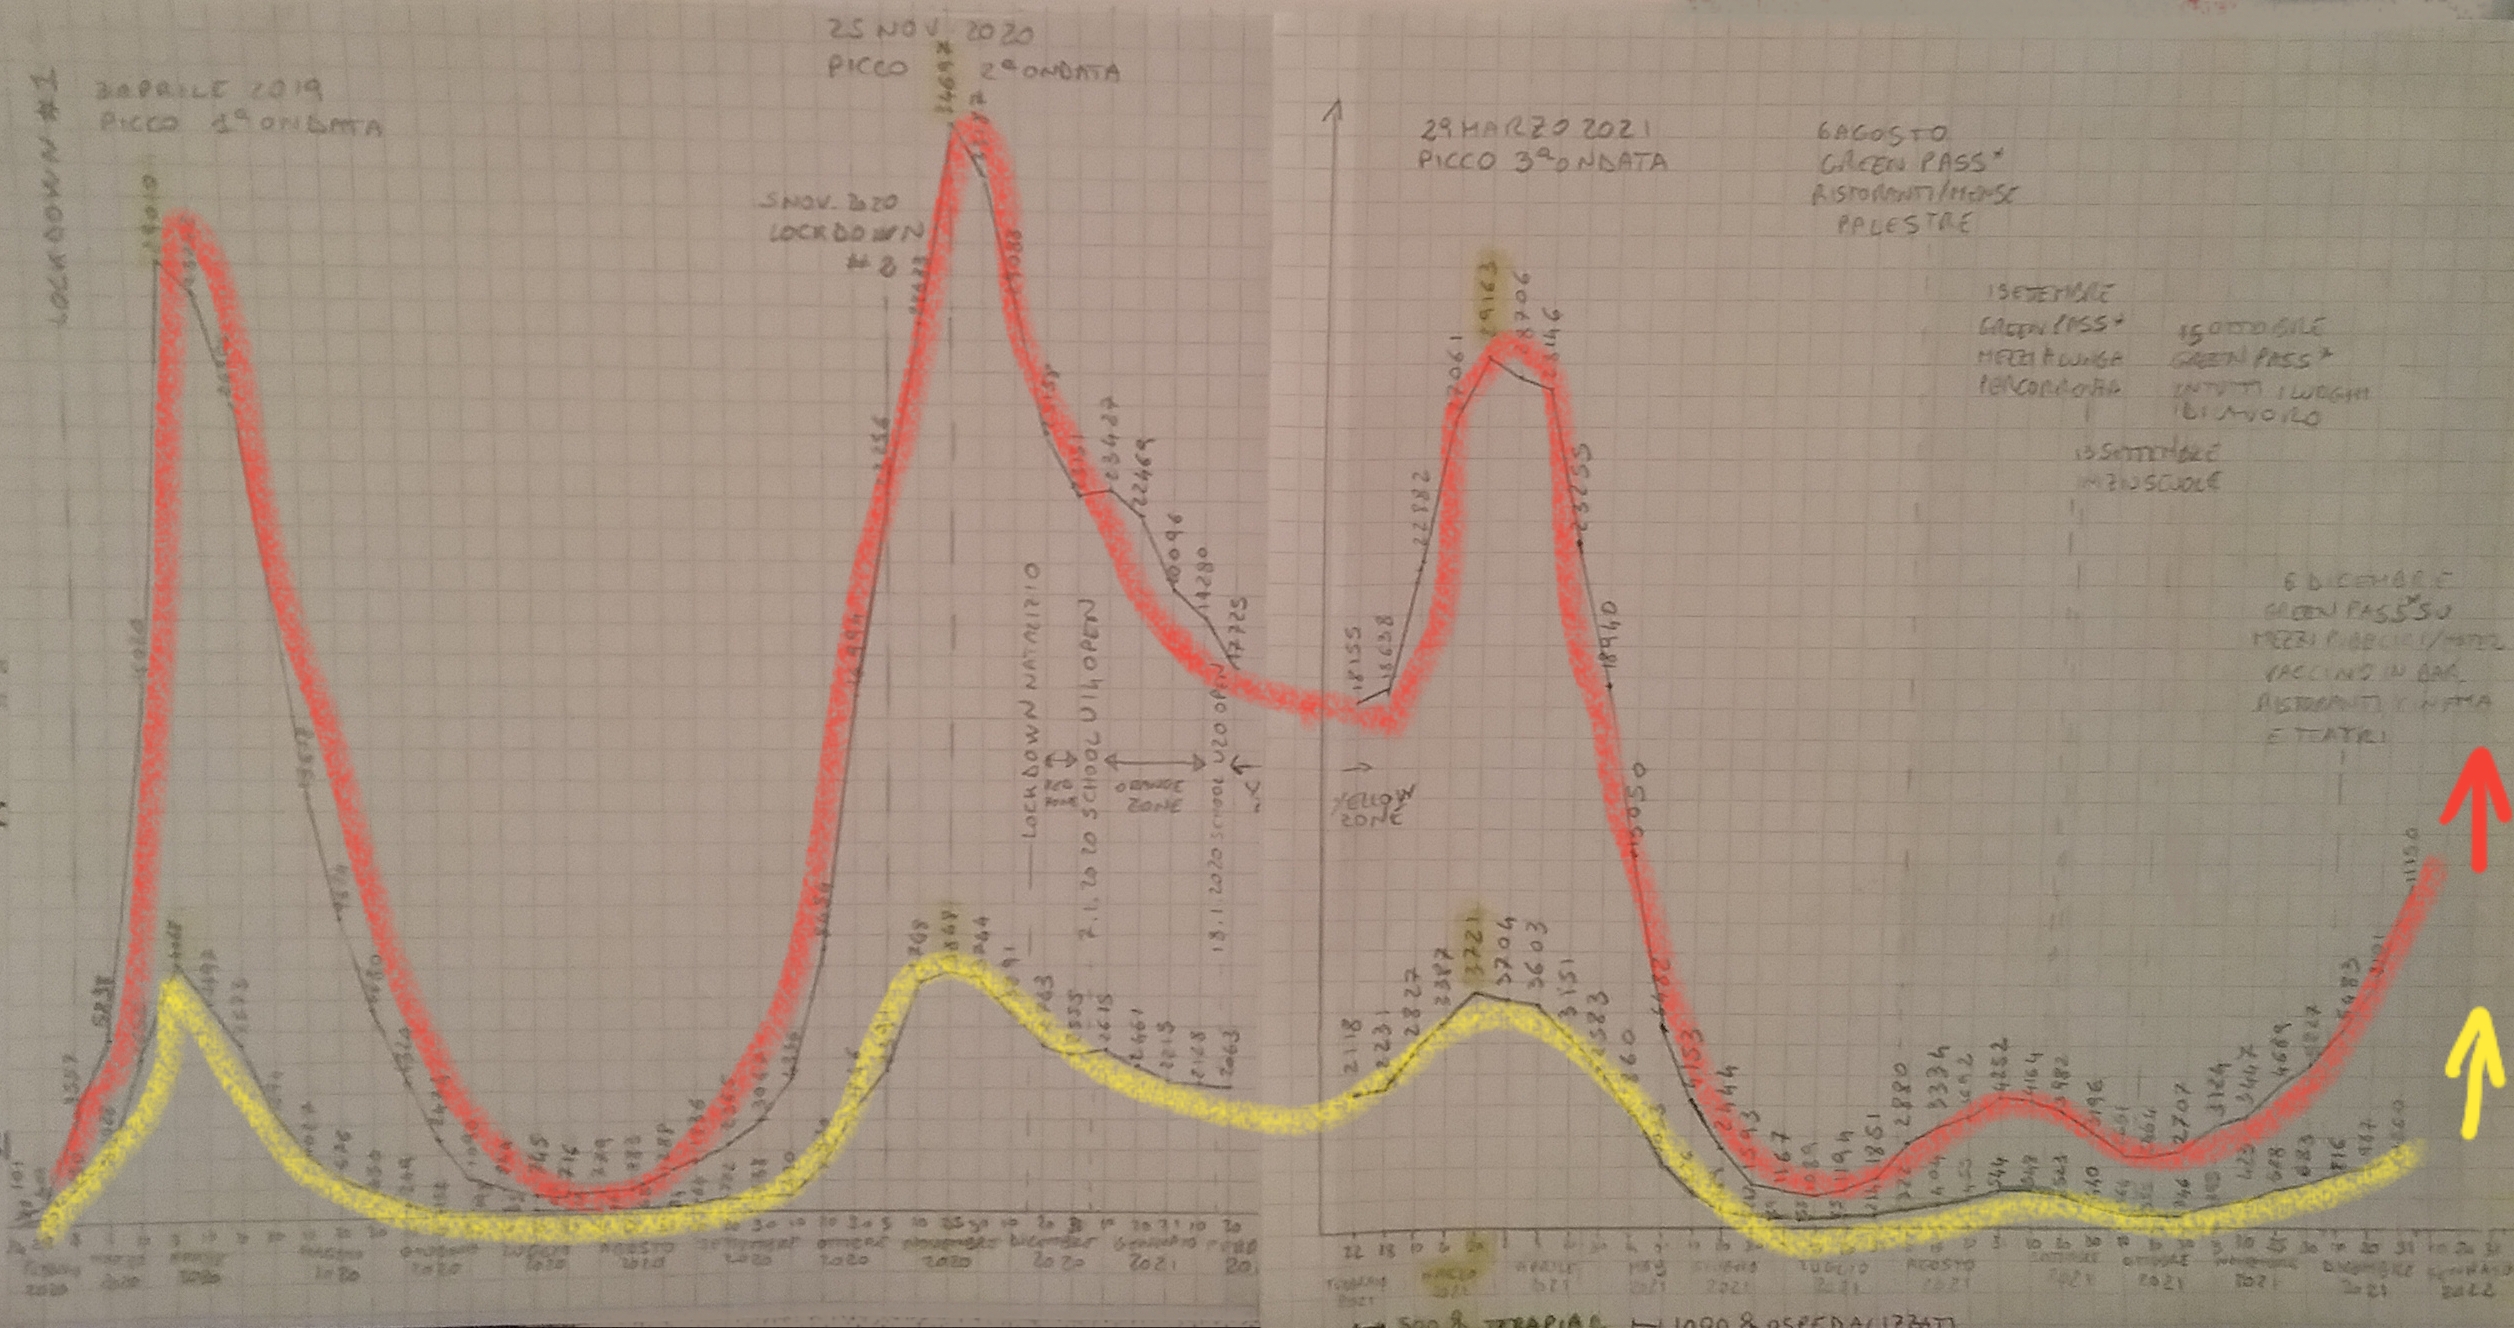
Number of hospitalized (red cross) and intensive care (yellow cross).
Today’s numbers are those of March 2020 (first wave), October 2020 (second wave) and March 2021 (third wave).
The peak should be in 3 weeks, looking at the curves.
Has it been decided to ‘circulate’ the virus?
Numero degli ospedalizzati (evidenziato in rosso) e terapie intensive (evidenziato in giallo)
I numeri di oggi sono quelli di marzo 2020 (prima ondata), di ottobre 2020 (seconda ondata) e marzo 2021 (terza ondata) .
Il picco dovrebbe essere tra 3 settimane, guardando le curve.
La decisione e’ quella di ‘far correre’ il virus?

Yellow zones: Calabria, Friuli-Venezia Giulia, Liguria, Marche, Veneto, Bolzano, Trento, Lombardia, Piemonte, Lazio, Sicilia, Toscana, Emilia-Romagna, Abruzzo, Valle d’Aosta.
Have been confirmed the indoor national competitions scheduled for next weekend in Terni (Cadets 14-17 years old) and Santa Venerina – Catania (Master 24-99 years old) reserved only for vaccinated immune for 9 months fencers and unvaccinated fencers not immune but exempt with green pass have been confirmed.
Erano già in zona gialla Calabria, Friuli-Venezia Giulia, Liguria, Marche, Veneto, Bolzano, Trento, Lombardia, Piemonte, Lazio e Sicilia. A queste oggi si aggiungono Toscana, Emilia-Romagna, Abruzzo e Valle d’Aosta.
Confermate le gare nazionali previste per il prossimo weekend a Terni (Cadetti 14-17 anni) e Santa Venerina – Catania (Master over 24) riservate ai soli schermidori vaccinati immuni da 9 mesi con green pass e non vaccinati esenti non immuni, ma con green pass.


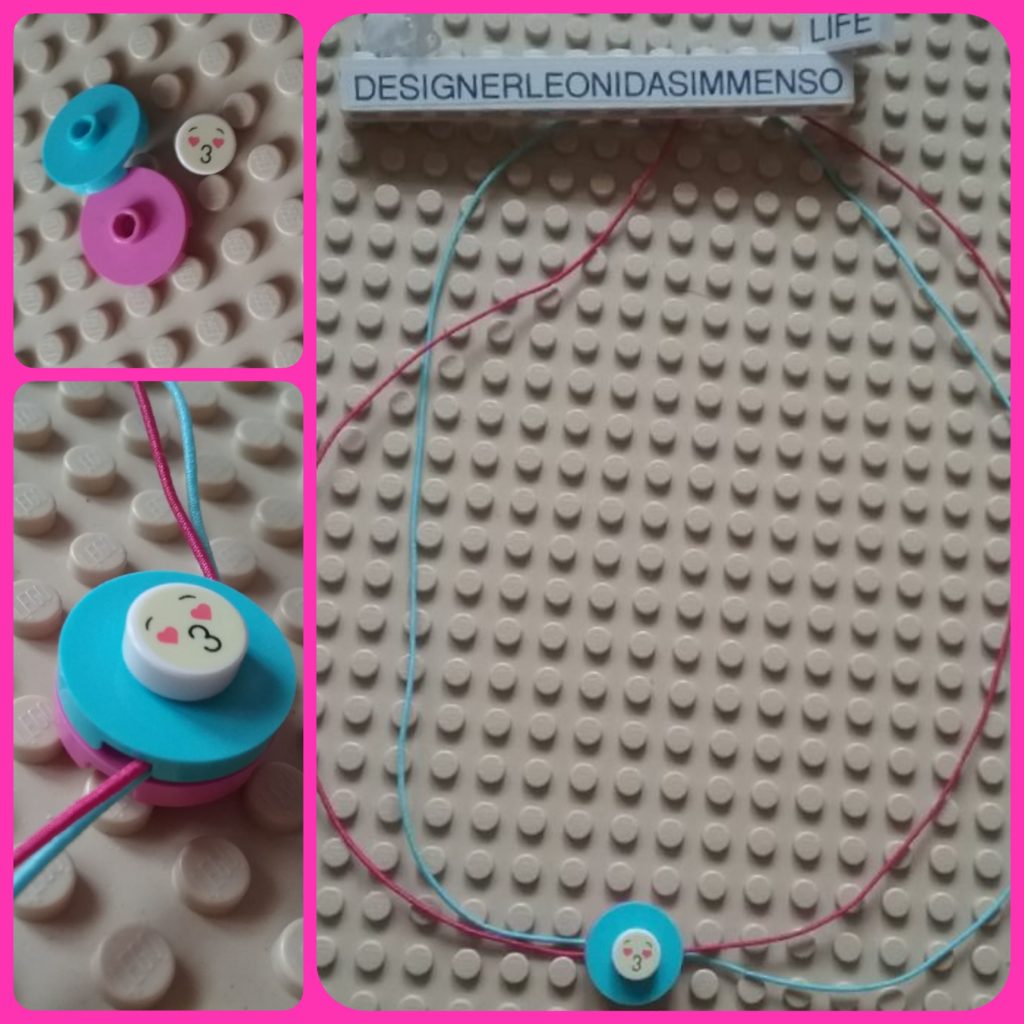
Lego Scala 4607 – Lego 1980
15 PARTS:
1 X Black Scala Ring with 1 x 2 Plate – Size Large
1 X Black Scala Ring with 1 x 2 Plate – Size Medium
1 X Black Scala Ring with 1 x 2 Plate – Size Small
1 X Black Tile 1 x 1 with Groove with White Top Pattern
2 X White Tile 1 x 1 with Groove with Red Heart Pattern
1 X Black Tile 1 x 1 with Groove with White Top and Purple Circle Pattern
1 X Black Tile 1 x 1 with Groove with Purple Top and White Circle Pattern
1 X White Tile 1 x 1 with Groove with Scala Red Top Pattern
1 X White Tile 1 x 2 with Groove with Three Red Flowers Pattern
1 X Black Tile 1 x 2 with Groove with Purple Top Rectangle whit White Edges Pattern
1 X Black Tile 1 x 2 with Groove with White Top and Two Purple Hearts Pattern
1 X White Tile, Round 2 x 2 with Eight Red Flowers Pattern
1 X Black Tile, Round 2 x 2 with Six Purple Hearts Pattern
1 X White Tile, Round 2 x 2 with Red/Blue Flower Pattern

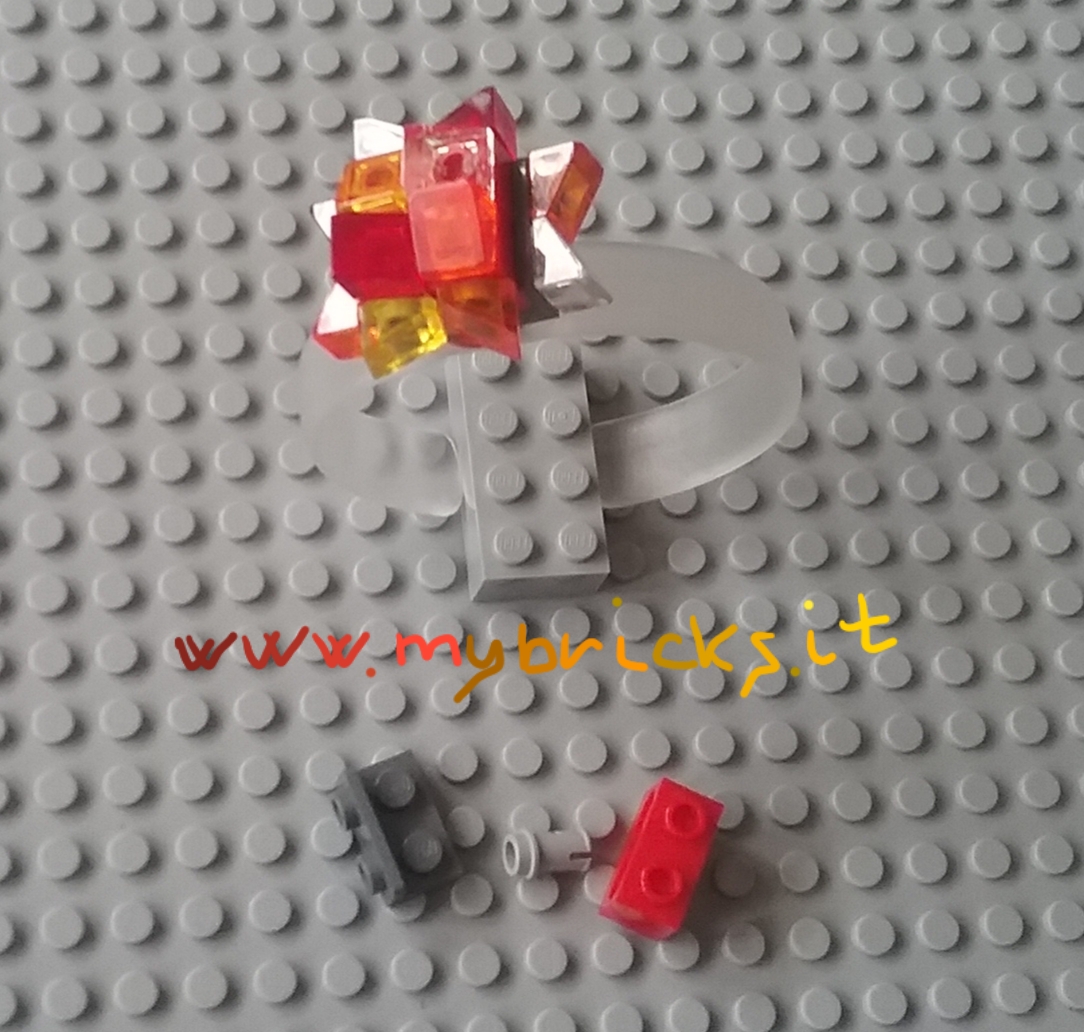
Lego Scala 4306 – Year 1980
15 PARTS:
1 X Red Scala Ring with 1 x 2 Plate – Size Large
1 X Red Scala Ring with 1 x 2 Plate – Size Medium
1 X Red Scala Ring with 1 x 2 Plate – Size Small
1 X Yellow Tile 1 x 1 with Red Top and Yellow Heart Pattern
2 X Yellow Tile 1 x 1 with Red Top Pattern
1 X Yellow Tile 1 x 1 with Red Heart Pattern
2 X White Tile 1 x 1 with Red/Blue Flower Pattern
1 X White Tile 1 x 2 with Three Red Flowers Pattern
1 X White Tile 1 x 2 with Red Rectangle Pattern
1 X YellowTile 1 x 2 with Two Red Hearts Pattern
1 X Yellow Tile, Round 2 x 2 with Two Red Rings Pattern
1 X White Tile, Round 2 x 2 with Eight Red Flowers Pattern
1 X Yellow Tile, Round 2 x 2 with Red/Blue Flower Pattern


The transition to the yellow zone is triggered if the limits of 10% in intensive care and 15% in the medical area are in the same time exceeded.
For the orange zone, the thresholds are 20% and 30% respectively.
For the red zone, the thresholds are 30% and 40% respectively.
Il passaggio alla zona gialla scatta se allo stesso tempo vengono superati i limiti del 10% in terapia intensiva e del 15% ospedalizzati.
Per la zona arancione le soglie sono del 20% in terapia intensiva e del 30% ospedalizzati.
Per la zona rossa le soglie sono rispettivamente del 30% e 40%.


Sources/Fonti: bollettino ufficiale della protezione civile; lab24 ilsole24ore vaccinati in tempo reale

10th september 2021
Below are the data of the current calculation of the percentage of immunity of the Italian population
40,855,591 (68,9%% of the population) vaccinated with a single dose on 10.09.2021
OF WHICH WHIT PREVIOUS INFECTION 1,453,237 (2.5% of the population)
39,402,354 vaccinated with a single dose on 10.09.2021 escluding vaccinations with previous infection
4,338,241 immune discharge / guaritis without vaccine for advanced infection on 10.09.2021
– 2,585,481 immune discharge / guaritis without vaccine for advanced infection on 10.03.2021
= 1,752,760 discharged / healed immune without vaccine for previous infection in the last 6 months
128,489 actually positive on 10.09.2021 which closed the green pass with vault cured
53,399,242 Italian population subject to vaccine (over 12)
Total immunity:
39,402,354 vaccinated with a single dose on 10.09.2021 including vaccinated with progressive infection
+1,752,760 discharged / healed immune without vaccine for previous infection in the last 6 months
+128,489 actually positive as of 10.09.2021 that will ‘earn’ the green pass when they will end with a healed
= 41,283,603 total ‘immune’ out of 53,399,242 equal to 77.31% of the Italian population subject to vaccine (over 12)
10 settembre 2021
Di seguito il dettaglio del calcolo attuale della percentuale di immuni della popolazione italiana
40.855.591 (68,9% della popolazione) vaccinati con almeno una dose al 10.09.2021
DI CUI CON PREGRESSA INFEZIONE 1.453.237 (2,5% della popolazione)
39.402.354 vaccinati con almeno una dose al 10.09.2021 escludendo dalla statistica i vaccinati con pregressa infezione
4.338.241 dimessi/guariti immuni senza vaccino per pregressa infezione al 10.09.2021
– 2.585.481 dimessi/guariti immuni senza vaccino per pregressa infezione al 10.03.2021
= 1.752.760 dimessi/guariti immuni senza vaccino per pregressa infezione negli scorsi sei mesi che hanno diritto al green pass
128.489 attualmente positivi al 10.09.2021 che avranno il green pass una volta guariti
53.399.242 platea della popolazione italiana soggetta a vaccino (over 12)
Totale immuni:
39.402.354 vaccinati con almeno una dose al 10.09.2021 escludendo i vaccinati con pregressa infezione1.752.760 dimessi/guariti immuni senza vaccino per pregressa infezione negli scorsi sei mesi che hanno diritto al green pass
+ 1.752.760 dimessi/guariti immuni senza vaccino per pregressa infezione negli scorsi sei mesi che hanno diritto al green pass
+ 128.489 attualmente positivi al 10.09.2021 che avranno il green pass una volta guariti
= 41.283.603 totale ‘immuni’ su 53.399.242 pari al 77,31% della popolazione italiana soggetta a vaccino (over 12)


August 31st 2021 – Covid 19 Fourth wave (Italy)
Below are the data of the current calculation of the percentage of immunity of the Italian population
Total immunity:
38,408,090 vaccinated with a single dose on 31.08.2021 including vaccinated with progressive infection
+ 1,867,646 discharged / healed immune without vaccine for progressive infection nails marked in months were directed to green pass
+ 137.925 actually positive as of 31.08.2021 that the green pass ended with a healed fly
= 40,413,661 total ‘immune’ out of 53,399,242 equal to 75.68% of the Italian population subject to vaccine (over 12)
————————————
31 Agosto 2021
Di seguito il dettaglio del calcolo attuale della percentuale di immuni della popolazione italiana:
Totale immuni:
38.408.090 vaccinati con almeno una dose al 31.08.2021escludendo i vaccinati con pregressa infezione
+ 1.867.646 dimessi/guariti immuni senza vaccino per pregressa infezione negli scorsi sei mesi che hanno diritto al green pass
+ 137.925 attualmente positivi al 31.08.2021 che avranno il green pass una volta guariti
= 40.413.661 totale ‘immuni’ su 53.399.242 pari al 75,68% della popolazione italiana soggetta a vaccino (over 12)

August 20th 2021 – Covid 19 (Italy) – 76% immune people
20 Agosto 2021 – Covid 19 (Italia) – 76% immuni
COVID NUMBERS updated to 2021.08.20
1,281,258 discharged healed as of 2020.12.21
4,211,080 discharged healed as of 2021.08.20
1,097,752 vaccinated with previous infection as of 2021.08.20
38,729,095 vaccinated with at least one dose as of 2021.08.20
NUMERI DEL COVID al 20.08.2021
1.281.258 dimessi guariti al 21.12.2020
4.211.080 dimessi guariti al 20.08.2021
1.097.752 vaccinati con pregressa infezione al 20.08.2021
38.729.095 vaccinati con almeno una dose al 20.08.2021
Considerations
Assuming that the vaccinated with a previous infection are relative to 2021 only, it appears that the unvaccinated with a previous infection, who should be ‘immune’ even if they have not had the vaccine and who are entitled to the green pass for 9 months are 1,832,070.
Considerazioni
Supponendo che i vaccinati con pregressa infezione siano relativi al solo 2021, risulta che i non vaccinati con pregressa infezione, che dovrebbero essere ‘immuni’ anche se non hanno fatto il vaccino e che hanno diritto al green pass per 9 mesi sono 1.832.070.
Here below the calculation’s details:
Il calcolo qui di seguito:
Out of an audience of 53,349,242 Italians, at least 38,729,095 people are ‘immunized’ with a dose.
Su una platea di 53.349.242 Italiani risultano ‘immunizzati’ almeno con una dose 38.729.095 persone.
Definitely the total percentage immunity amounts to 76,029% of the audience relative to the Italian population calculated here below:
In definitiva l’immunità percentuale totale ammonta al 76,029% della platea relativa alla popolazione italiana calcolata come segue:


Today’s data are similar to those of early October 2020, in which period there was a sharp rise in the second wave curve, which culminated on 2020 December 27th, following the second lockdown on 2020 November 5th.
Is this a fourth wave, despite almost 65% of the Italian population being vaccinated?
I dati di oggi sono simili a quelli di inizio ottobre 2020, nel cui periodo si registrava una forte salita della curva della seconda ondata, culminata il 27 dicembre 2020, a seguito del secondo lockdown del 5 novembre 2020.
Si tratta di una quarta ondata, nonostante i vaccinati siano quasi il 65% della popolazione italiana?


For three days there has been a slight mathematical inflection in improvement.
Normally about 4 weeks pass before the curve incorporates the restrictive measures adopted (in this case: the closure of schools on March 1st)
Da tre giorni si nota una lieve flessione al miglioramento.
Trascorrono normalmente circa 4 settimane prima che la curva recepisce le misure restrittive adottate (in questo caso: la chiusura delle scuole il 1 marzo)


Since 20th February both curves start to rise again.
Dal 20 febbraio le curve hanno ricominciato a salire.


Curves continue to drop and the number of healed now exceeds the increase in the number of positive cases compared to the previous day.
Si continua a scendere e il numero dei guariti ora supera l’incremento del numero dei casi positivi rispetto al giorno precedente.


Here are the current curves, updated to date. They go down. Slowly, but they go down.
Ecco le curve attuali, aggiornate ad oggi. Si scende. Piano, ma si scende.


The curves are going down!
Le curve ricominciano a scendere!


The red one is the hospitalized curve. The yellow one is for those hospitalized in intensive care. Since December 31st the curves have stopped going down. We are stalled, tending to rise. In the next few days we will understand if it could be the beginning of the third wave or a steady moment of the descent.
Quella rossa è la curva degli ospedalizzati. Quella gialla i ricoverati in terapia intensiva. Dal 31 dicembre le curve hanno smesso di scendere. Siamo in stallo, tendente alla risalita. Nei prossimi giorni capiremo se potrebbe essere l’inizio della terza ondata o un momento stazionario della discesa.


Peak reached
Picco raggiunto

On the left in yellow the old curves of March / April (under the intensive care and above the hospitalized). On the right in red the current curves (under the intensive care and above the hospitalized). Last Saturday (November 14, 2020) there was the inflection. We should peak in the middle of next week. Let’s hope … 🍀🍀🍀
A sinistra in giallo le vecchie curve di marzo/aprile (sotto la terapia intensiva e sopra gli ospedalizzati).
A destra in rosso le attuali curve (sotto la terapia intensiva e sopra gli ospedalizzati).
Sabato scorso (14 novembre 2020) c’è stato il flesso. A metà della prossima settimana dovremmo raggiungere il picco. Speriamo…🍀🍀🍀

Hello Bricks! Here is a piece of the fall collection of Designerleonidasimmenso specially designed for Lego Ideas.
I hope you enjoy it!


Those above are the ICU curves. On the left, in orange, the ‘old’ curve highlighted with an orange x on March 17, corresponding to today’s numbers (right curve, in red).
Italian Government plans a new lockdown for the Country.
The peak of the ‘old’ curve was reached 3 weeks after the lockdown on April 1st. It is therefore hoped that a new lockdown will bring the new curve down around 25 November 🤔
Quelle di sopra sono le curve della terapia intensiva. Sulla sinistra, in arancio, la curva ‘vecchia’ con evidenziato con la x arancione il 17 marzo, corrispondente ai numeri di oggi (curva a destra, in rosso).
Il Governo prevede un nuovo lockdown per tutta la penisola italiana.
Il picco della curva ‘vecchia’ é stato raggiunto dopo 3 settimane dal lockdown il 1 aprile. Si auspica pertanto che un nuovo lockdown faccia scendere la nuova curva intorno al 25 novembre 🤔


Those above are the curves of hospitalized patients: on the left, in orange, the ‘old’ curve highlighted with the orange x on March 22, corresponding to today’s numbers (right curve, in red).
Italian Government plans a new lockdown for the Country.
The peak of the ‘old’ curve was reached 3 weeks after the lockdown on April 4th. It is therefore hoped that a new lockdown will bring the new curve down around 29 November 🤔
Quelle di sopra sono le curve degli ospedalizzati: sulla sinistra, in arancio, la curva ‘vecchia’ con evidenziato con la x arancione il 22 marzo, corrispondente ai numeri di oggi (curva a destra, in rosso).
Il Governo prevede un nuovo lockdown per tutta la penisola Italiana.
Il picco della curva ‘vecchia’ é stato raggiunto dopo 3 settimane dal lockdown il 4 aprile. Si auspica pertanto che un nuovo lockdown faccia scendere la nuova curva intorno al 29 novembre 🤔


The situation is again out of control
La situazione è di nuovo fuori controllo


The curves are starting to rise again from 31 August 2020
Le curve stanno ricominciando a salire dal 31 agosto 2020

Foreward
This is not a medical analysis and is not intended to replace the medical-scientific investigations in progress.
This is a statistical analysis of data relating to COVID 19. Specifically, the trend of hospitalized and intensive care cases in Italy is analyzed.
Premessa
Questa non è un’analisi medica e non vuole sostituirsi alle indagini medico-scientifiche in corso.
Si tratta di un’analisi statistica di dati relativi al COVID 19. Nello specifico viene analizzato l’andamento dei casi ospedalizzati e di quelli in terapia intensiva, in Italia.
Since the beginning of the pandemic due to COVID 19, at the end of February 2020, I began, out of pure instinct of curiosity, to trace the curves by noting the numbers of infected people communicated by the daily bulletin of civil protection.
Sin dall’inizio della pandemia dovuta al COVID 19, a fine febbraio 2020, ho cominciato, per puro istinto di curiosità a tracciare le curve rilevando i numeri delle persone contagiate comunicate dal bollettino giornaliero della protezione civile.
Every day I was saddened to point out the number of sick people which was increasing more and more.
I wondered if the Gaussian curve would peak and when this would happen.
Ogni giorno mi rincresceva indicare il numero dei malati che aumentavano sempre più.
Mi sono chiesta se la curva gaussiana avrebbe avuto un picco e quando questo sarebbe avvenuto.

Tracciamento manuale della curva pandemica dei casi in terapia intensiva a partire dal 12 marzo 2020
I observed the Wuhan curve and documented myself.
What I have deduced is that in about 4 weeks the virus has grown exponentially.
The origin of it all was on December 2, 2019, when at the fish market, in the area of the sale of live animals, a family (husband, wife and child) sold a bat in a cage.
Bats are considered the main reservoirs of coronaviruses: different types of coronaviruses have been identified in bats, including the human coronavirus that causes the common flu. However, bat coronaviruses do not cause serious infections in humans. Pets can also be infected with coronavirus, but in most cases it causes a mild intestinal infection and none of the pet coronaviruses have ever been identified as a cause of infection in humans.
Ho osservato la curva di Wuhan e mi sono documentata.
Quanto ho dedotto è che in circa 4 settimane il virus è cresciuto esponenzialmente.
L’origine di tutto, il 2 dicembre 2019, quando al mercato del pesce, nell’area della vendita di animali vivi, una famiglia (marito, moglie e figlio) vendeva un pipistrello in una gabbietta.
I pipistrelli sono considerati i principali serbatoi dei coronavirus: nei pipistrelli sono stati identificati differenti tipologie di coronavirus, come anche il coronavirus dell’uomo che causa il comune raffreddore. Tuttavia i coronavirus dei pipistrelli non causano infezioni gravi nell’uomo. Anche gli animali domestici possono essere infettati da coronavirus, ma nella maggior parte dei casi provoca una lieve infezione intestinale e nessuno dei coronavirus degli animali domestici è mai stato identificato come causa di infezione nell’uomo.
Let’s go back to the Wuhan live animal market. In addition to bats, there are several species of animals on sale. Among the animals for sale there are also pangolins, endangered animals, renowned for their scales.
It is possible that the ‘zero family’; sold both: the bat and the pangolin.
It is also likely that both were placed in a cage.
In the same cage.
Since the genome of the pangolin is very similar to the human one, I suppose that the passage of the virus from the bat – probably infected – to the pangolin was immediate.
Torniamo al mercato di animali vivi di Wuhan. Oltre ai pipistrelli, in vendita si trovano diverse specie di animali. Tra gli animali in vendita ci sono anche i pangolini, animaletti in via di estinzione, rinomati per le loro squame.
È possibile che la ‘famiglia zero’; vendesse entrambi: il pipistrello e il pangolino.
E’ inoltre probabile che entrambi fossero stati messi in una gabbietta.
Nella stessa gabbietta.
Poiché il genoma del pangolino è molto simile a quello umano suppongo che il passaggio del virus dal pipistrello – probabilmente infetto – al pangolino sia stato immediato.

Pangolino – Mammifero dell’ordine Folidoti
After a while, the family fell ill and all three members died.
An outbreak developed in the market that grew exponentially, until the Chinese government approved the closure of the Wuhan market.
But how could the virus have been transmitted, from pangolin to man?
My investigations, from a biological point of view, led me to the discovery that the pangolin, in addition to having a genome very similar to ours, is a territorial animal that marks the territory by emitting an odorous acid from glands located near the anus.
In my opinion, the explosion of the virus may have originated precisely from the flatulent emissions of the small scaly animal.
For this reason, I am quite convinced that the virus can also be transmitted through cigarette smoke and that, in addition to their coughing and sneezing, also the fumes of infected smokers can be a very dangerous vehicle for transmitting COVID 19.
Dopo poco la famiglia si è ammalata e sono morti tutti e tre i componenti.
Nel mercato si è sviluppato un focolaio che è cresciuto esponenzialmente, fino a che il governo cinese ha deliberato la chiusura del mercato di Wuhan.
Ma come puo’ essere stato trasmesso il virus, dal pangolino all’uomo?
Mi sono documentata dal punto di vista biologico per scoprire che il pangolino, oltre ad avere un genoma molto simile al nostro, e’ un animale territoriale che marca il territorio emettendo un acido odoroso da ghiandole posizionate vicino all’ano.
L’esplosione del virus a mio parere puo’ aver avuto origine proprio dalle emissioni flatulente del piccolo animaletto squamato.
Per questo motivo sono abbastanza convinta che anche tramite il fumo delle sigarette possa trasmettersi il virus e che, oltre alla tosse e agli starnuti, anche le esalazioni dei fumatori infetti possano essere un pericolosissimo veicolo di trasmissione del COVID 19.
In a flash the distances have been zeroed and evil has crossed the whole world.
We found that we were all the same, small, but great. With the will to fight. With the desire to start over, rediscovering that the essential is in a hug, in a smile, in dialogue, in social relationships and the only important thing to protect is life.
Based on these considerations, I decided to statistically check the data, in order to monitor pandemic growth.
In un battibaleno le distanze si sono azzerate e il male ha attraversato tutto il mondo.
Ci siamo trovati uguali, piccoli, ma grandi. Con la voglia di combattere. Con la voglia di ricominciare, riscoprendo che l’essenziale sta in un abbraccio, in un sorriso, nel dialogo, nei rapporti sociali e l’unica cosa importante da proteggere è la vita.
Sulla base di queste considerazioni ho deciso di controllare statisticamente i dati, per monitorare la crescita pandemica.

Punto di incrocio della curva coi dati cumulati con quella dei dati giornalieri a partire dal giorno del lockdown (12.3.2020)
I crossed the Gaussian curve of the accumulated historical data, with the one related to the daily data communicated by the civil protection (represented in the column in pencil next to the green one).
I detected an average of about 4 weeks for the manifestation of the effects of the virus and, by crossing the daily data curve with the cumulative one , I forecasted the peak date on Sunday March 29, 2020 (indicated with the red arrow).
It took about 4 weeks to complete the history starting from the day before the lockdown and the actual peak date was detected on April 3, 2020 with a number of patients in intensive care equal to 4,068.
Ho incrociato la curva gaussiana dei dati storici cumulati, con quella relativa ai dati giornalieri comunicati dalla protezione civile (rappresentati nella colonna in matita a fianco a quella verde).
Ho rilevato una media di circa 4 settimane per la manifestazione degli effetti del virus e, incrociando la curva dei dati giornalieri con quelli cumulati, ho calcolato previsionalmente la data di picco il giorno di Domenica 29 marzo 2020 (indicato con la freccia rossa).
Per esaurire lo storico a partire dal giorno precedente al lockdown sono servite circa 4 settimane e la previsione si è verificata con la data di picco effettiva rilevata il giorno 3 aprile 2020 con un numero di malati in terapia intensiva pari a 4.068.

Tracciamento manuale della curva pandemica dei casi in terapia intensiva a partire dal 12 marzo 2020
The virus curve had a time of manifestation in the single person of about 4 weeks. The Gaussian curve plotted with the daily data starting from March 11, day of the lockdown start, which began with +277 daily cases in intensive care and 1028 cumulative ones , ran then out within 4 weeks, starting from the day of the peak, after about 4 weeks, on May 10, 2020, with 1027 cases detected.
The same applies to the curve for hospitalized cases, not in intensive care.
The Gaussian curve relevant to hospitalized cases has risen exponentially exactly with the times of the Gaussian curve plotted for patients in intensive care.
La curva del virus ha avuto un tempo di manifestazione nella singola persona di circa 4 settimane, e la curva gaussiana tracciata coi dati giornalieri a partire dall’11 marzo, giorno di inizio del lockdown, che partiva con +277 casi giornalieri in terapia intensiva, e 1028 casi cumulati, si è poi esaurita nel giro di 4 settimane, a partire dal giorno del picco, dopo circa 4 settimane, il giorno 10 maggio 2020, con 1027 casi rilevati.
Stesso dicasi per la curva relativa ai casi ospedalizzati, non in terapia intensiva.
La curva gaussiana degli ospedalizzati è salita esponenzialmente esattamente coi tempi della curva gaussiana tracciata per i malati in terapia intensiva.

Tracciamento manuale della curva pandemica dei casi ospedalizzati a partire dal 12 marzo 2020
The incredible peak of 28,976 hospitalized cases was reached on April 6,2020, after a period of about 4 weeks from the lockdown start..
The zone closure would not have been effective. Already on television, shortly before the lockdown, during the transmission of the tragic bulletins, reports were broadcast on how to overcome the barriers of national borders. An Italian woman in Paris explained live how she had helped her mother to bypass all checks, traveling by train, to reach her before giving birth… and in the meantime people were dying … and so the virus, despite the bans, was expanding exponentially …
The zone closure would not even have been effective in my opinion for another reason: each region involved would have screamed injustice and the population would probably have tried to reach an area not involved, in order not to comply with the rules, ignoring the virus that was expanding in the meantime.
Thus, within 4 weeks the curve peaked. And this happened within a month thanks to the lockdown. The only effective measure to make the population understand the gravity and extent of the pandemic. Only in this way the accumulated historical data could be absorbed and the pandemic growth was controlled, avoiding a possible health disaster. If this had not been the case, the exponential growth would probably have been out of control and health care could no longer cope with the treatment of the newly infected. Only in this way the population did understand. Otherwise the situation would have degenerated.
The virulent load is currently very low and the number of people admitted to hospital has stopped at around 750 since Friday July12, the day in which the Gaussian curve reached its minimum. Also the number of people in intensive care since July 12 stopped at about 50 units. From the traced curves it appears that there are about 800 positive sick people being treated (hospitalized + intensive care) and that this number is fixed from 12 July 2020.
Il picco incredibile di 28.976 ricoverati è stato raggiunto il giorno 6 aprile 2020, dopo un periodo di circa 4 settimane dall’inizio del lockdown.
La chiusura a zone non sarebbe stata efficace. Già in televisione, poco prima del lockdown, durante la trasmissione dei tragici bollettini, venivano trasmessi report di come superare le barriere dei confini posti a livello nazionale, come quello di una donna italiana a Parigi, che spiegava in diretta di come aveva fatto bypassare alla madre tutti i controlli, viaggiando in treno, per raggiungerla prima del parto….
… e intanto la gente moriva …. e cosi’ il virus, nonostante i divieti, si espandeva in maniera esponenziale…
Così, nel giro di 4 settimane la curva ha raggiunto il picco. E questo é successo nel giro di un mese grazie al lockdown. Unica misura efficace per far comprendere alla popolazione la gravità e l’entità della pandemia.
Solo così i dati storici cumulati si sono potuti assorbire e la crescita pandemica è stata controllata evitando un eventuale disastro a livello sanitario.
Se così non fosse stato, probabilmente la crescita esponenziale sarebbe stata fuori controllo e la sanità non avrebbe potuto più far fronte alle cure dei nuovi infetti. Solo così la popolazione ha capito. Altrimenti la situazione sarebbe degenerata.
La carica virulenta è al momento molto bassa e la soglia delle persone ricoverate in ospedale è ferma a circa 750 malati da venerdi 12 luglio, giorno in cui la gaussiana ha toccato il minimo, come pure il numero di persone in terapia intensiva, che, dal 12 luglio è fermo a circa 50 persone.
Dalle curve tracciate risulta che sono circa 800 le persone positive malate in cura (ricoverati + terapia intensiva) e che questo numero è fisso dal 12 luglio 2020.
FINAL CONSIDERATIONS
Unfortunately, from the second half of August, the 2 curves began to rise again, with numbers which, while leaving the number of patients in intensive care below 70 patients, are currently exceeding the 1000 infected among the hospitalized.
CONSIDERAZIONI CONCLUSIVE
Purtroppo a partire dalla seconda quindicina di agosto, le 2 curve hanno ricominciato a risalire, con numeri, che pur lasciando contenuto il numero di pazienti in terapia intensiva al di sotto dei 70 pazienti, attualmente sforano i 1000 contagiati tra gli ospedalizzati.

By behaving responsibly: using masks, sanitizing our hands, observing the distance, and – above all – trying to stay far away to those who smoke outdoors, I am convinced that in a short time even the numbers communicated by the media will be more reasonable and …. we will finally be able to say: “We did it!”
Comportandoci responsabilmente: utilizzando le mascherine, igienizzando le mani, mantenendo le distanze, e – soprattutto – cercando di stare lontani da chi fuma all’aperto, sono convinta che in breve tempo anche i numeri comunicati dai media saranno più contenuti e…. potremo dire finalmente: “Ce l’abbiamo fatta!”


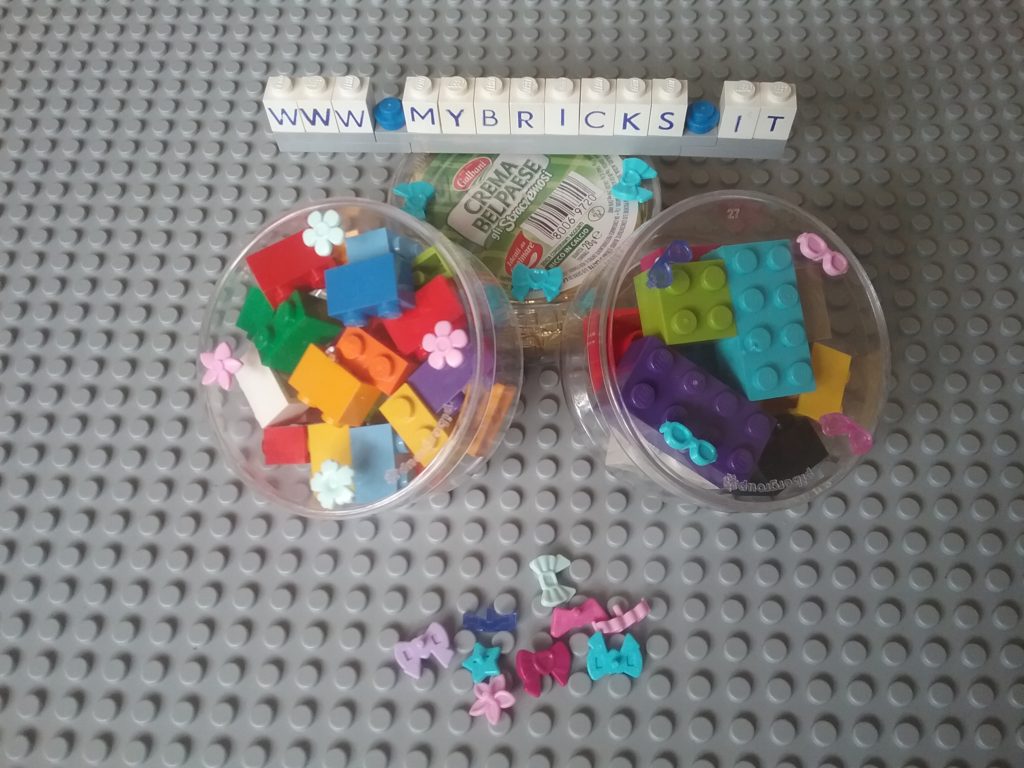
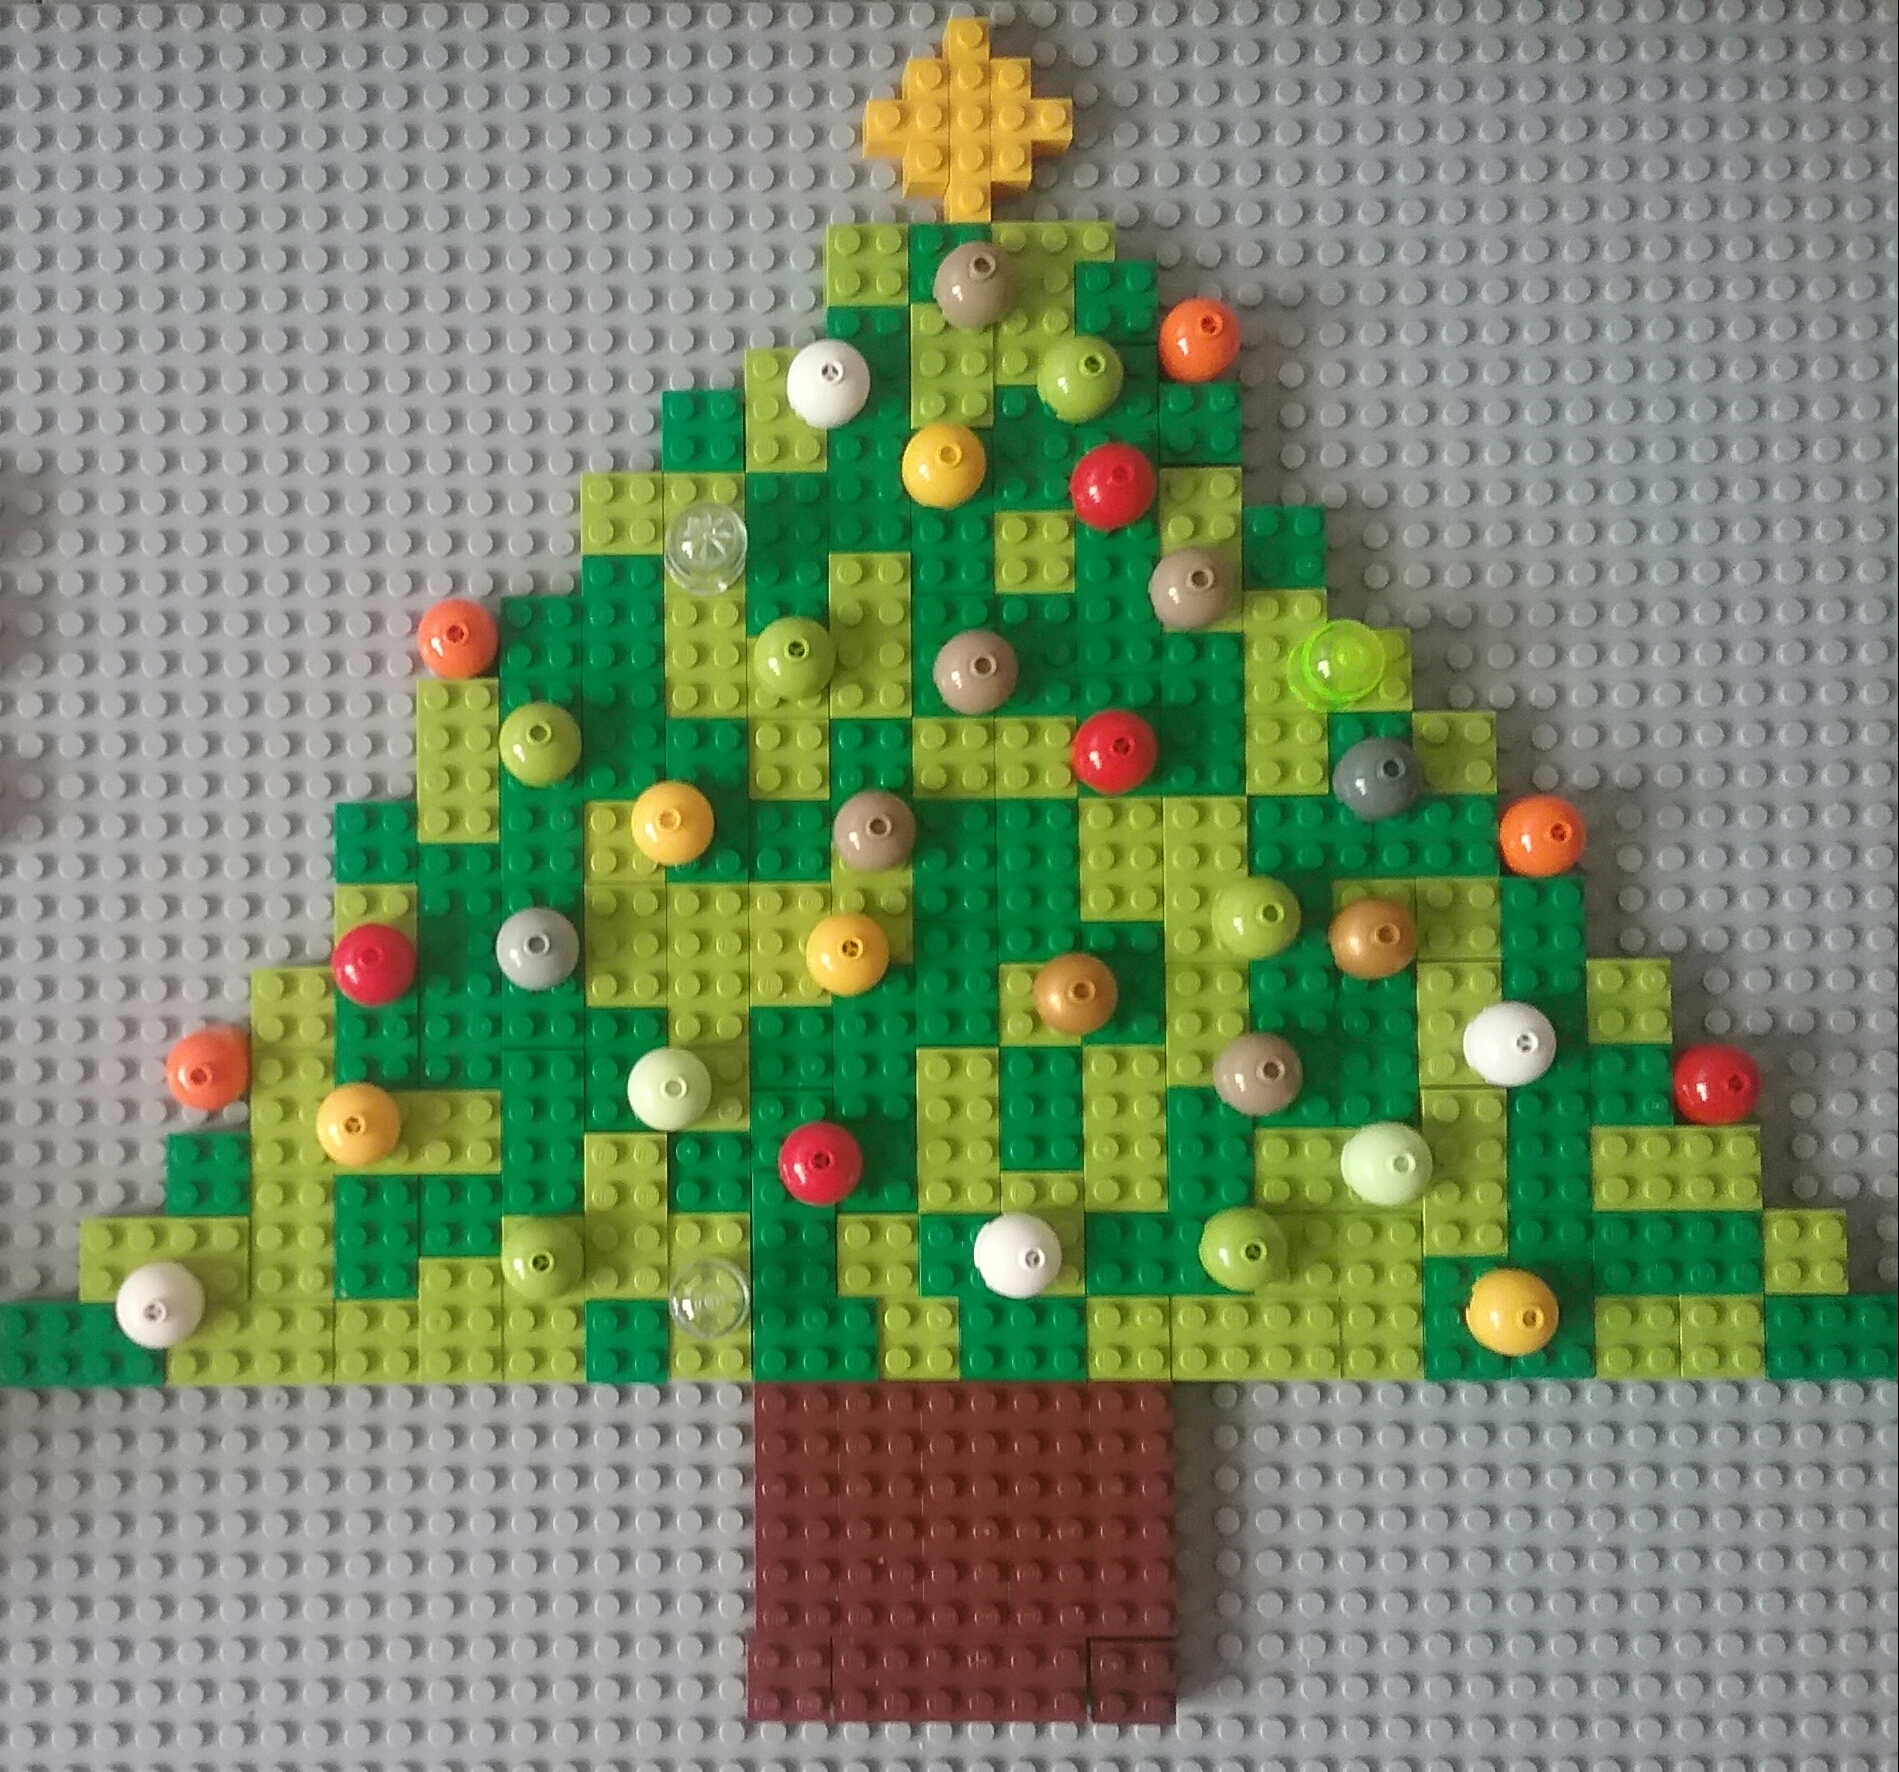
Decorations: little stars and dots 2×2


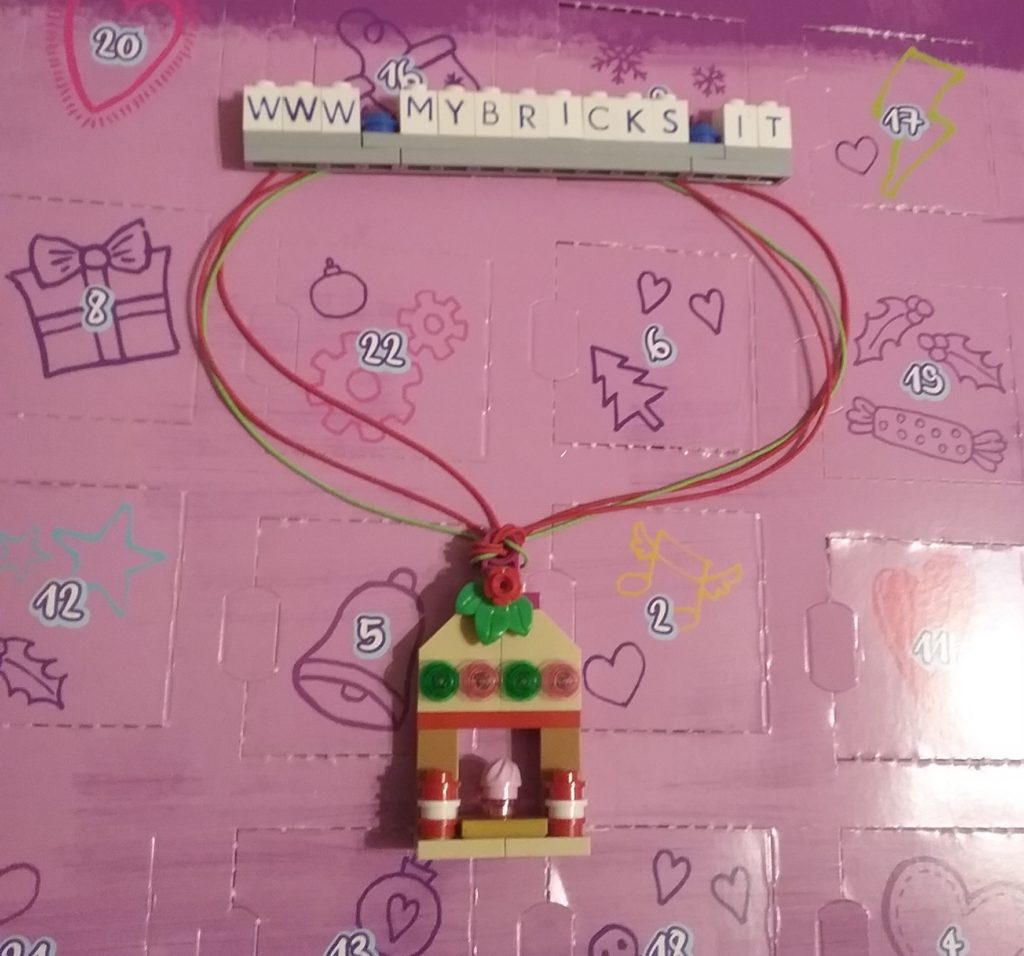


Lego Friends Christmas Cake Necklace Day #16

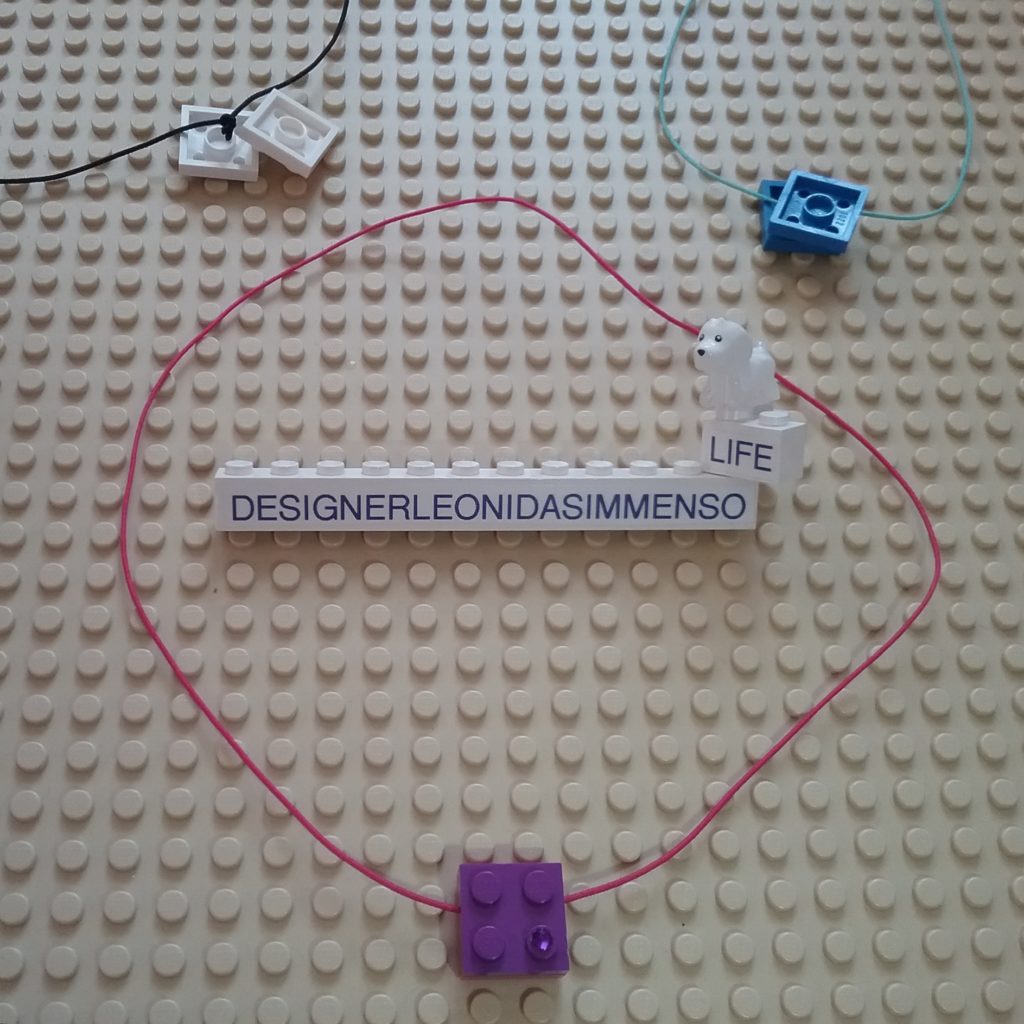
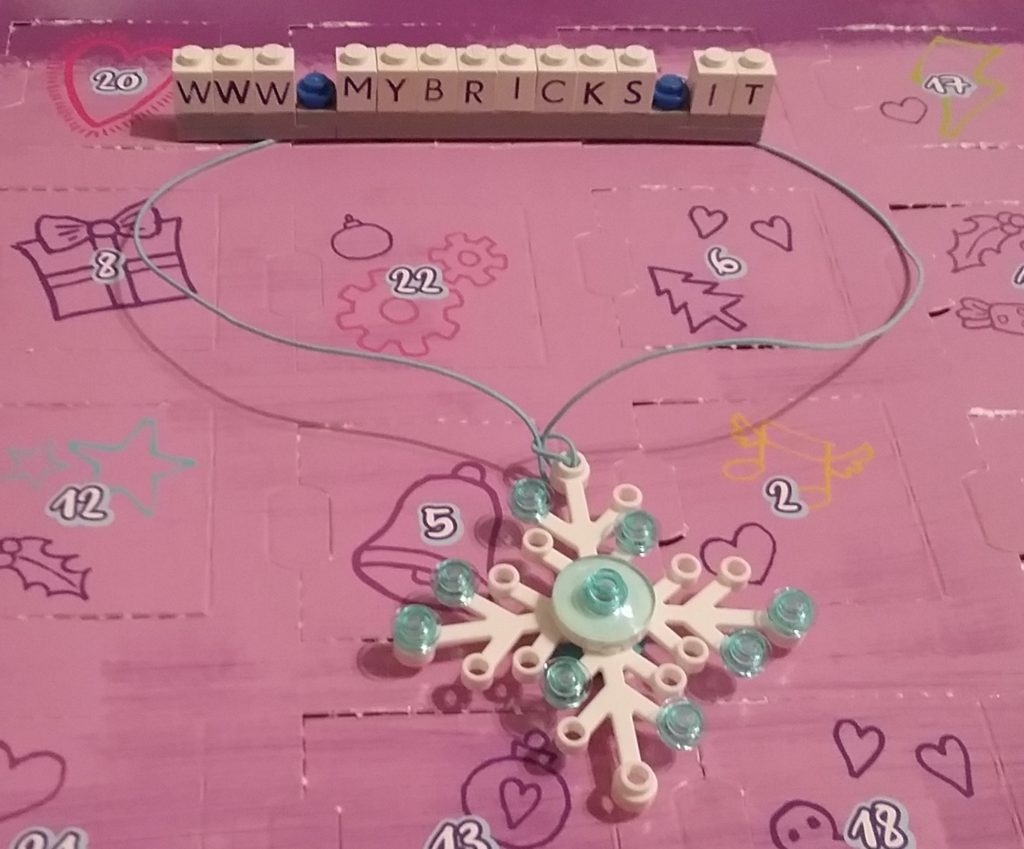
Lego Friends Royal Diadem Necklace Day #15

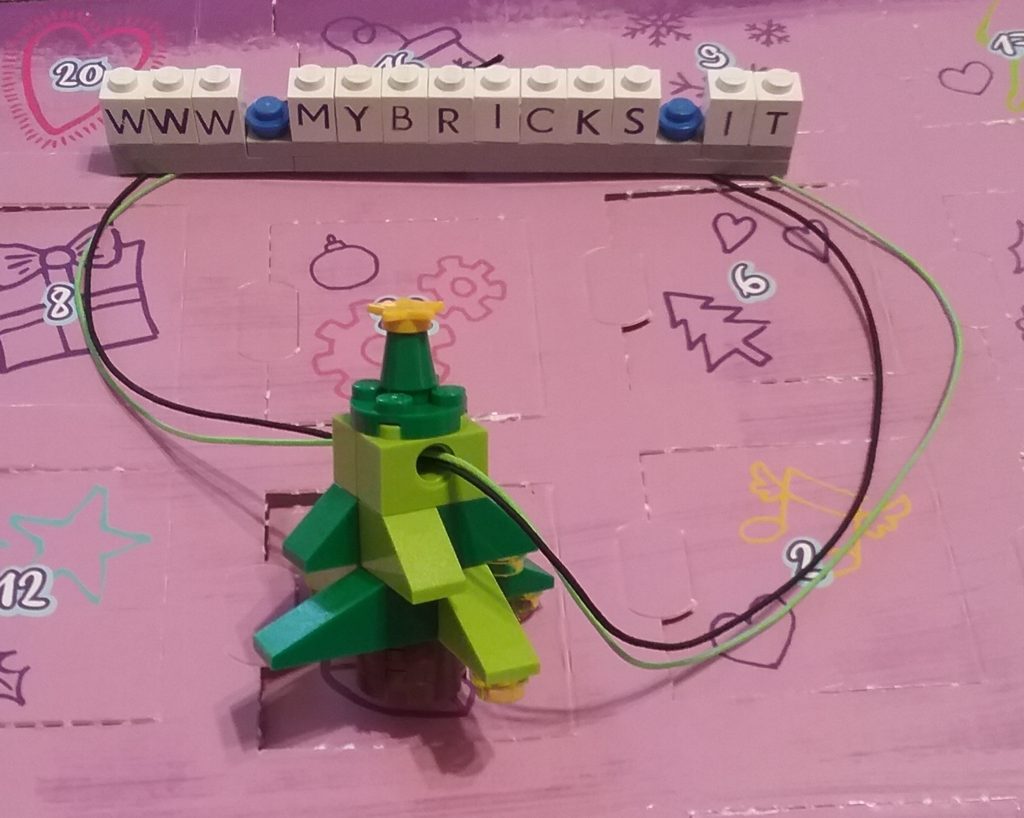
Lego Friends Christmas Piano Necklace Day #14

Lego Friends Christmas Wreath Necklace Day #13

Lego Friends Coctail Drink Necklace Day #12
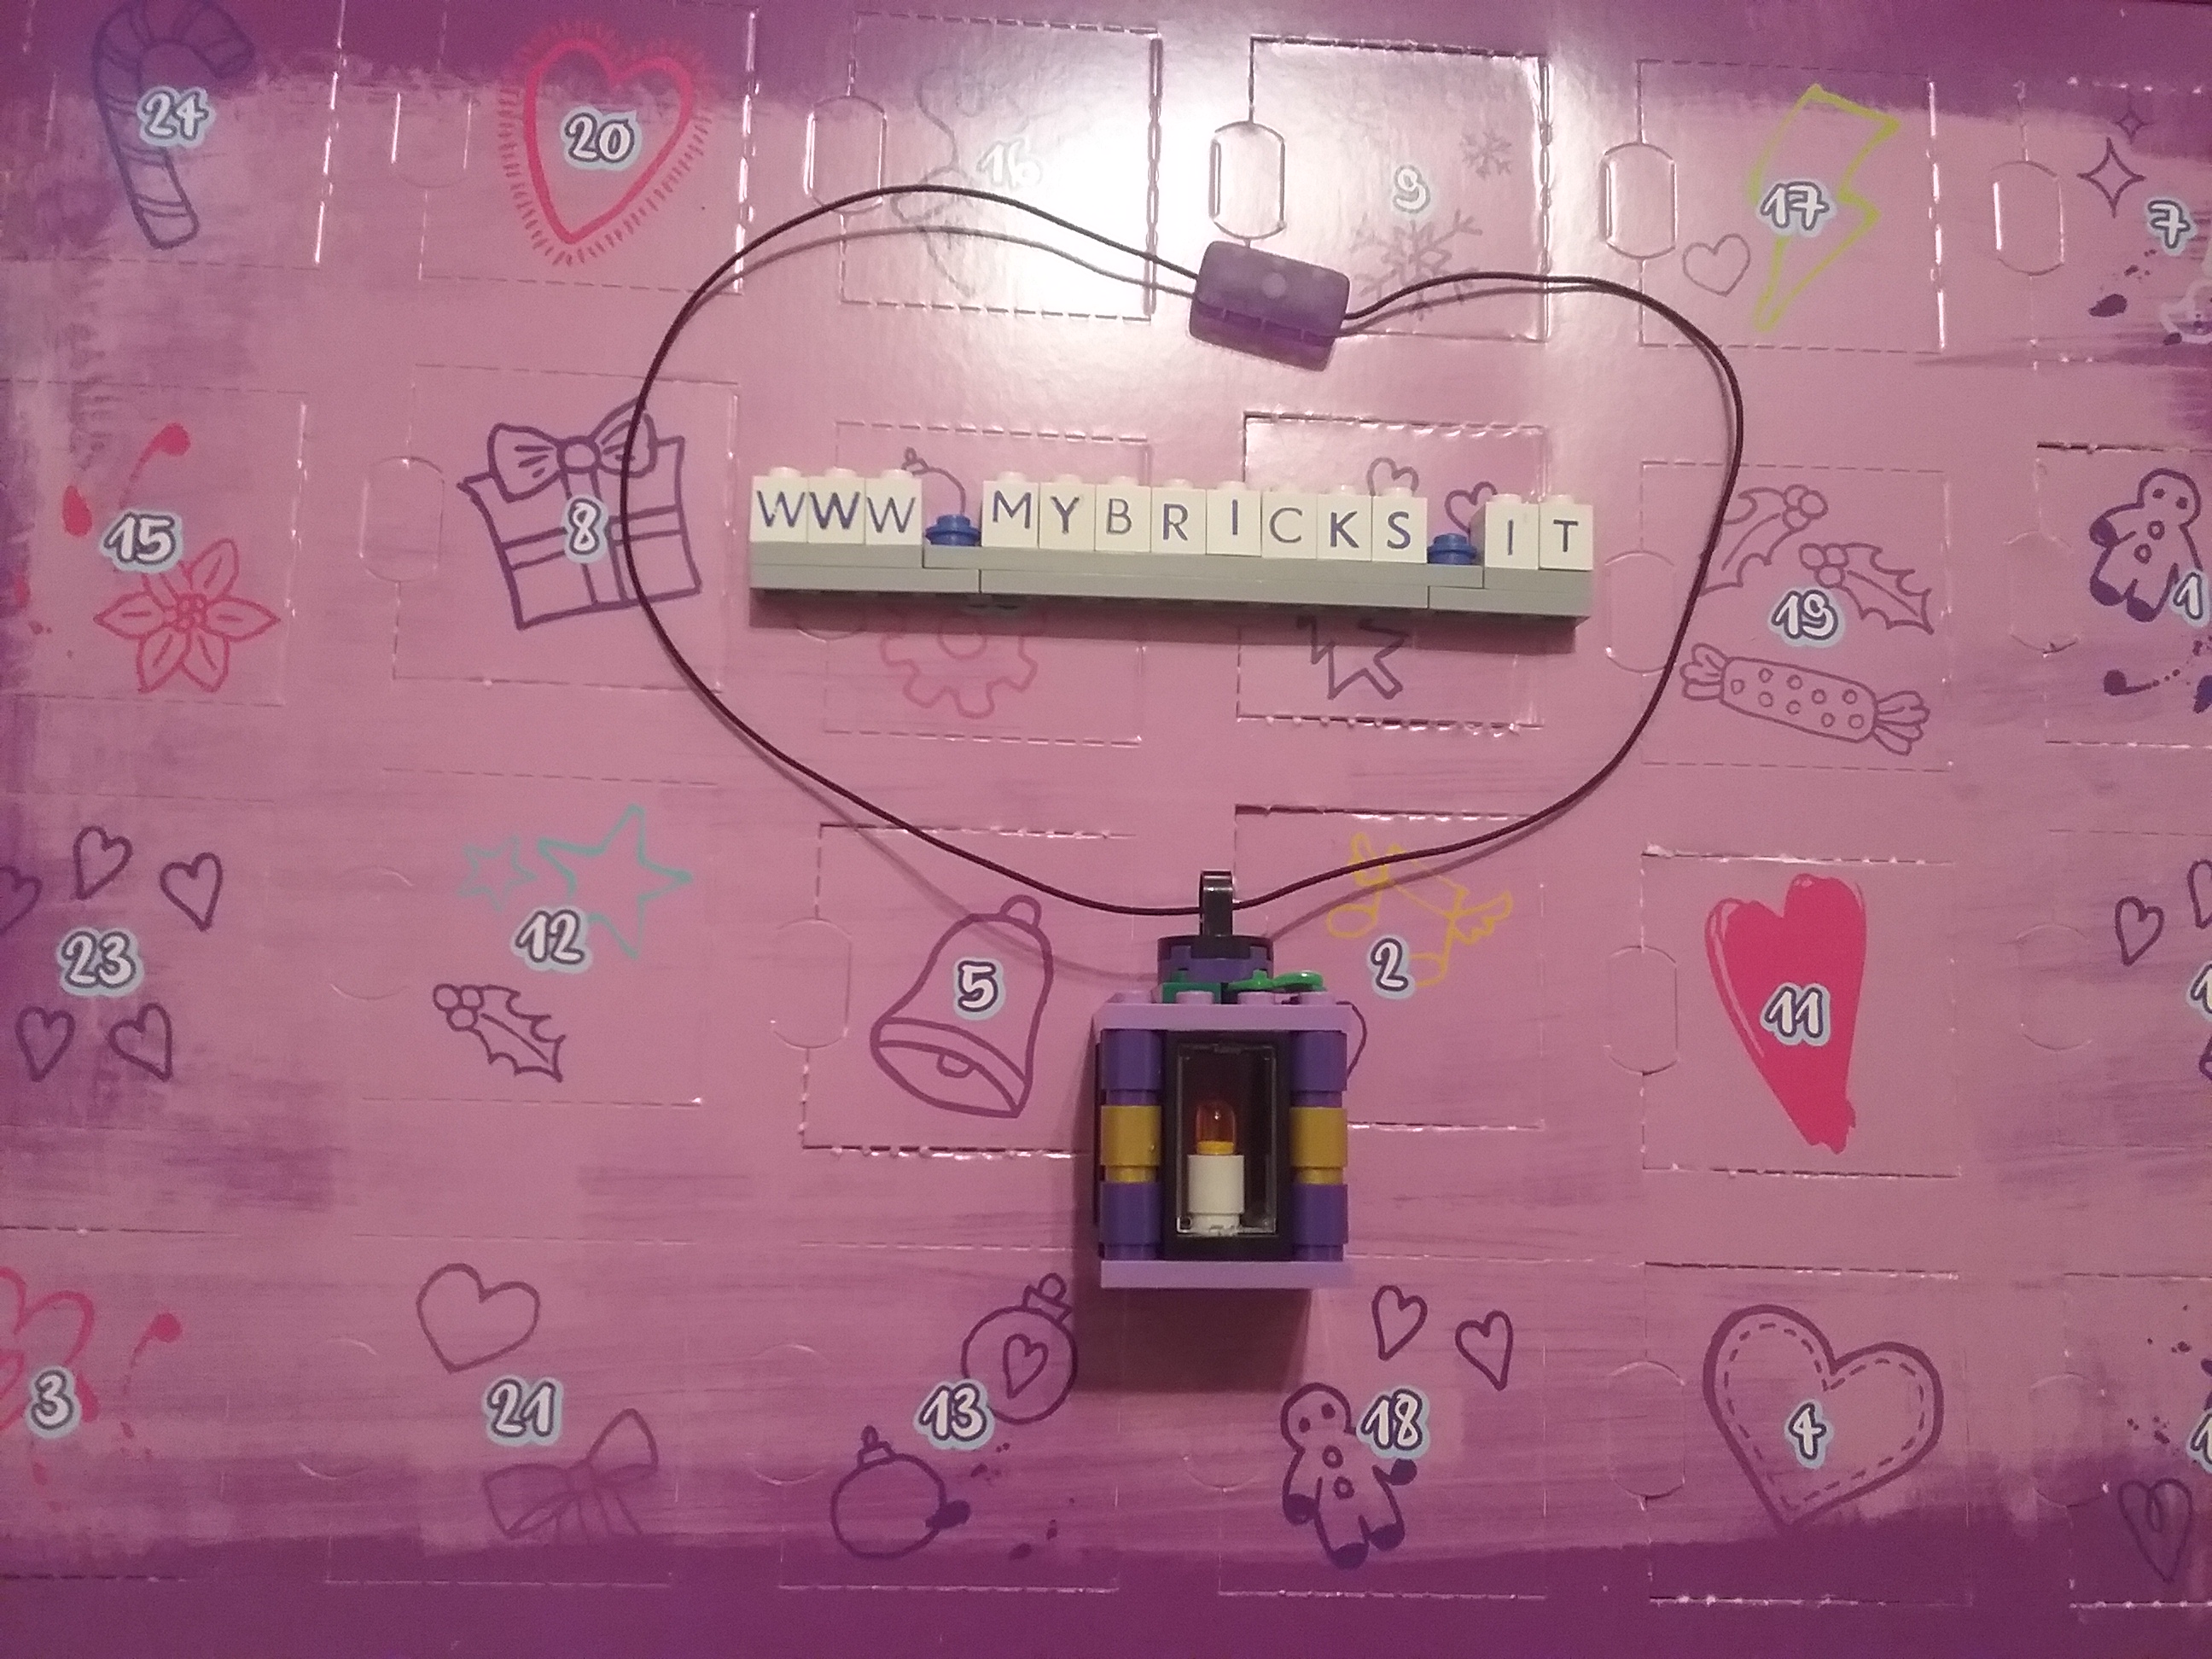
Lego Friends Christmas Lantern Necklace Day #11

Lego Friends Christmas Candle Necklace Day #10

Lego Friends Reindeer Necklace Day #9

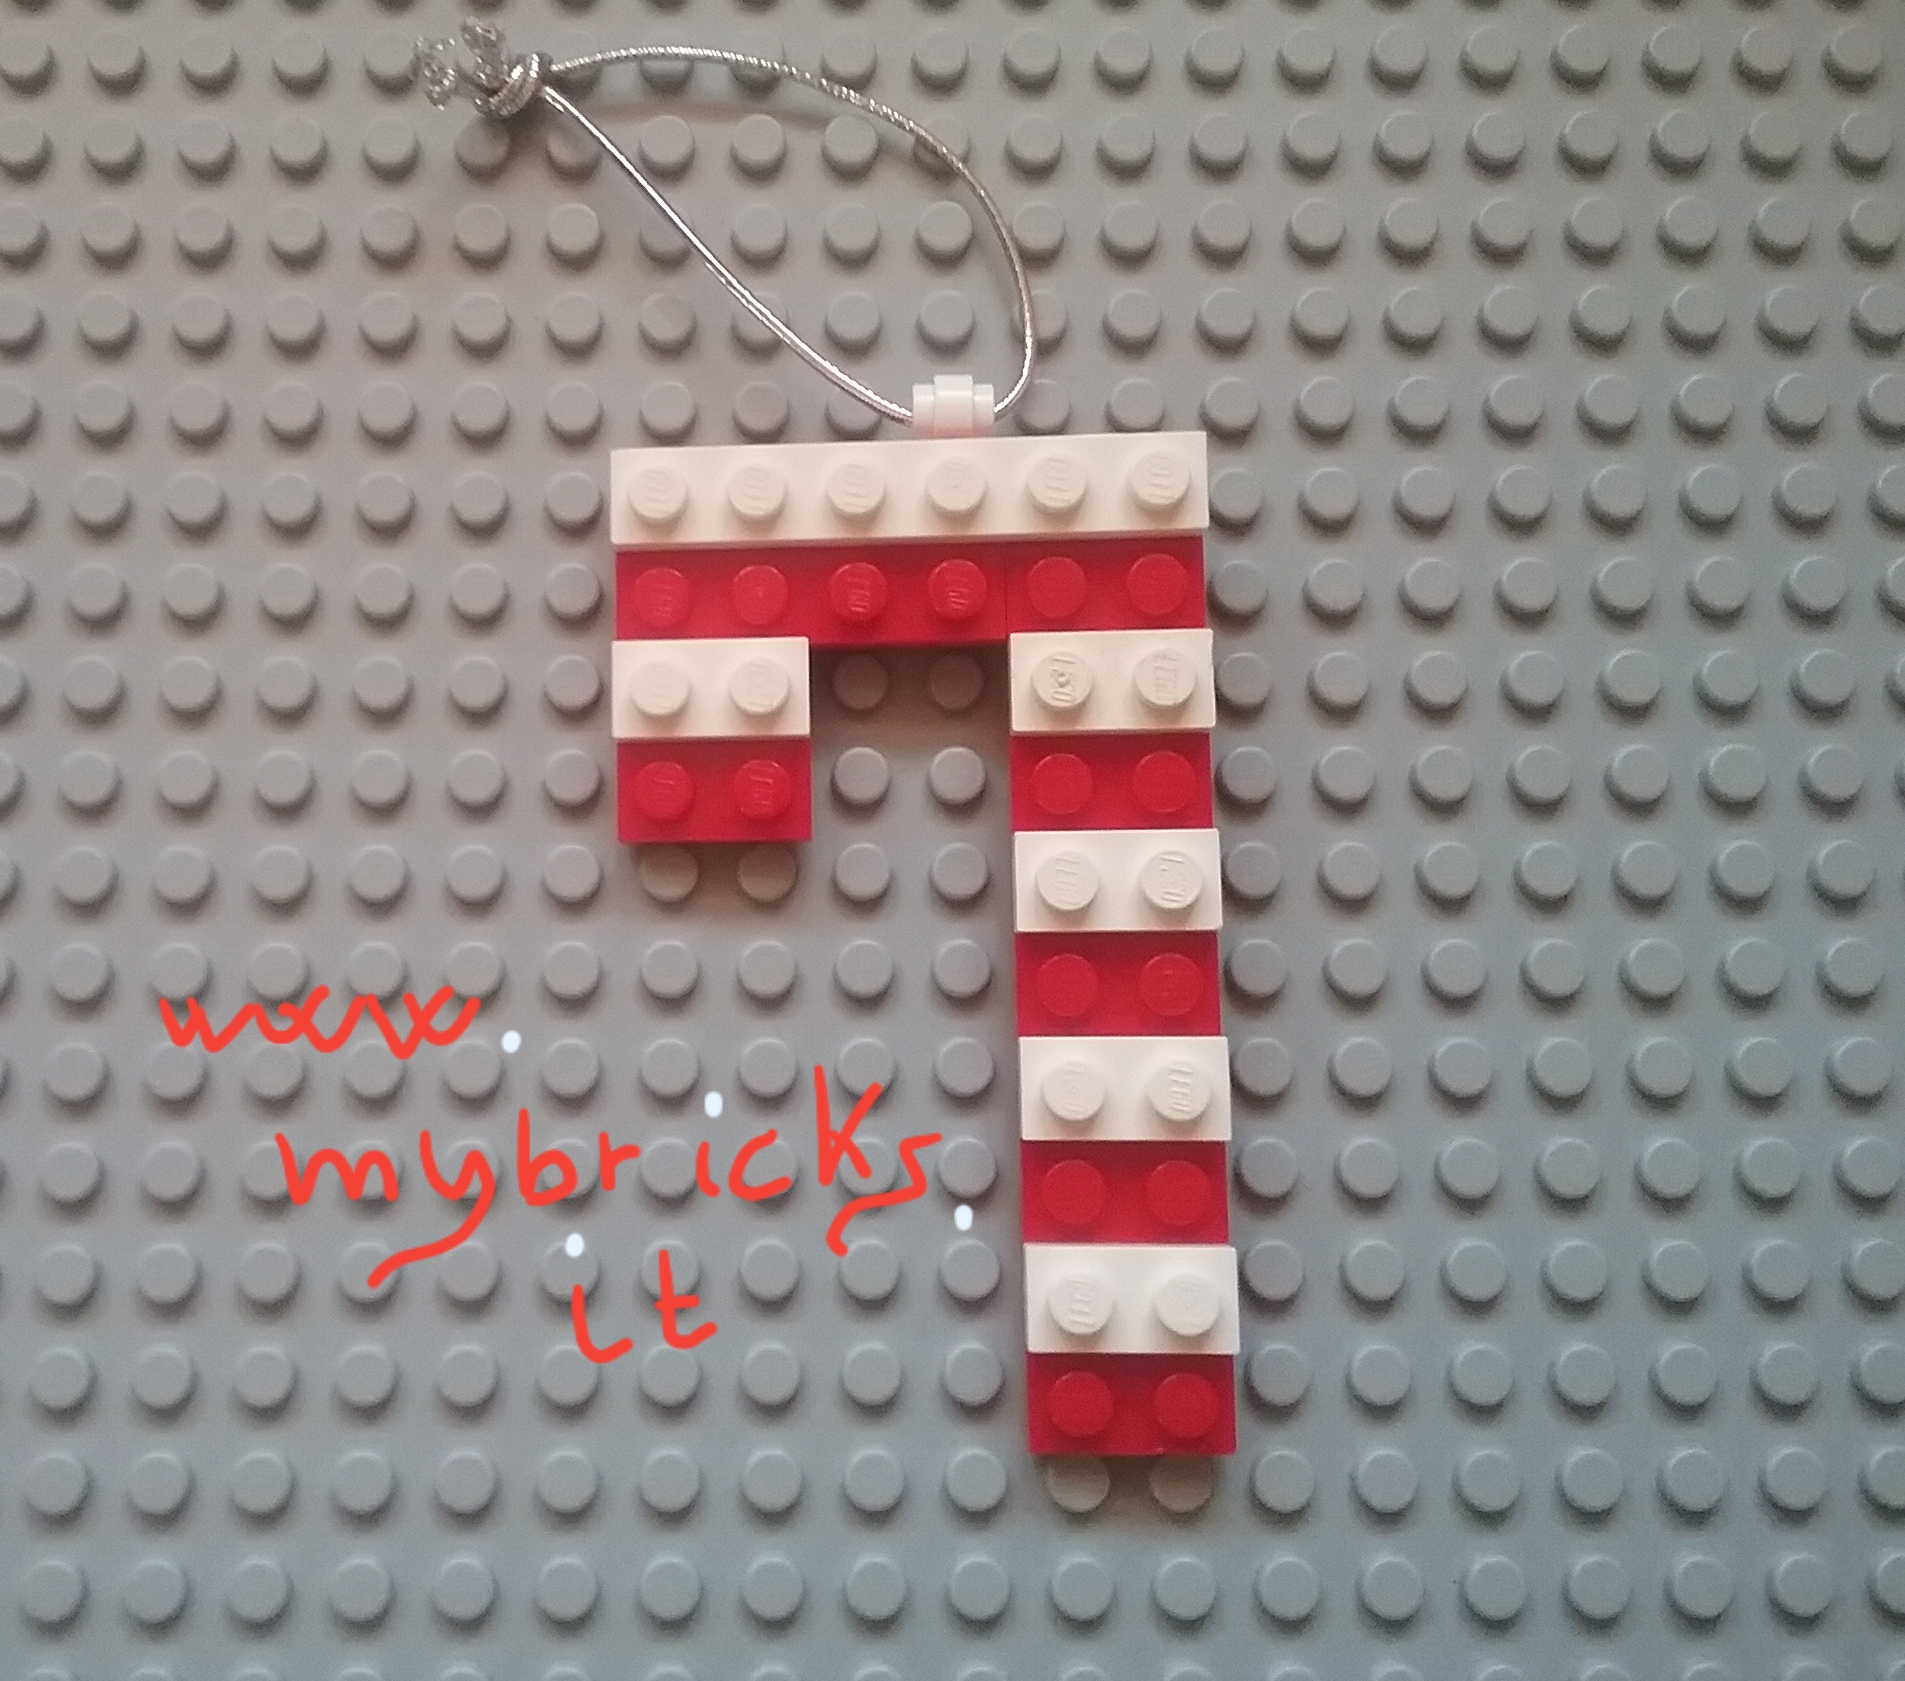
Lego Friends Candy Stick Necklace Day #8

Lego Friends Camera Necklace Day #7

Lego Friends Epiphany sock Necklace Day #6

Lego Friends Snowman necklace Day #5

Lego Friends Hearth necklace Day #4

Lego Friends Bells necklace Day #3

Lego Friends Electric Guitar necklace Day #2

Lego Friends heart necklace Day #1

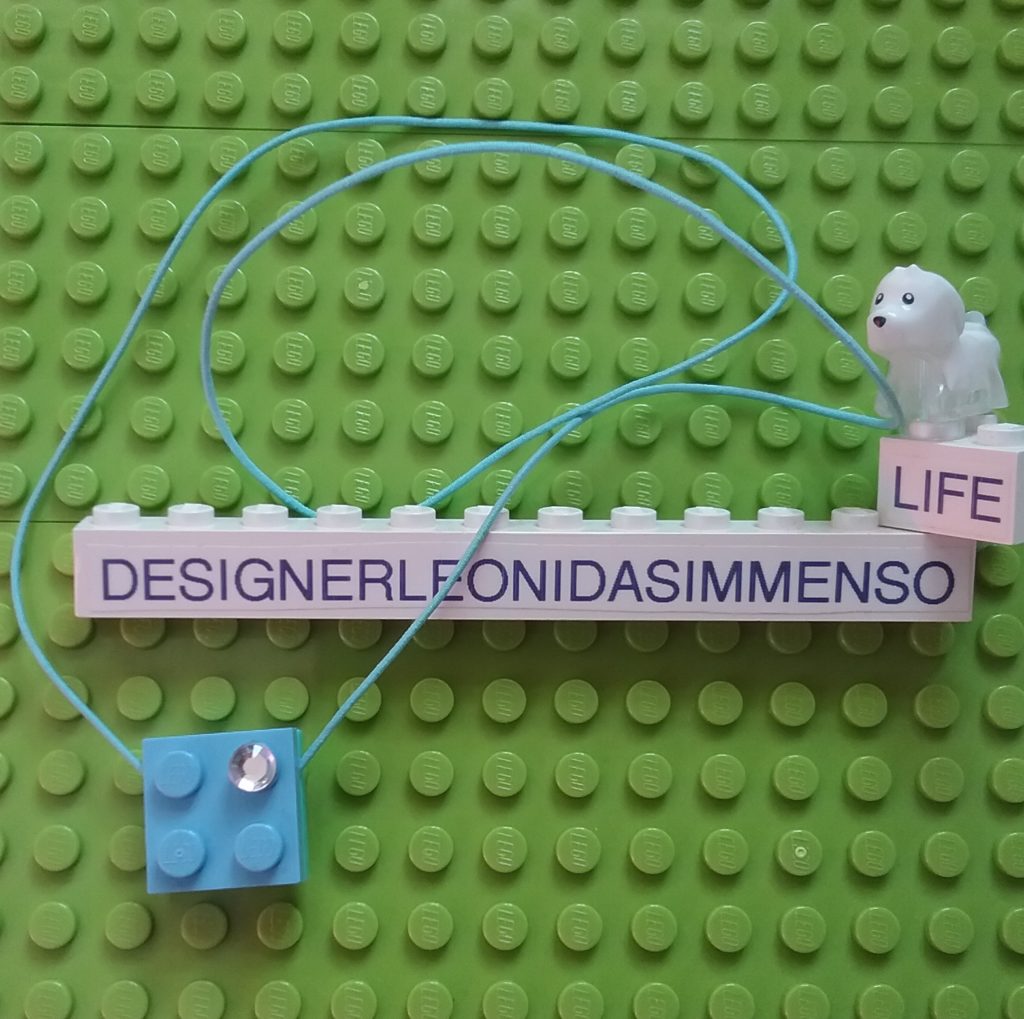
Mybricks Crystal effect Lego charm
Andreea Made it! Lovely!

Mybricks Purple Bloom Jewels

My favourite Lego Snack
Mybricks.it

Mybricks Braid Effect Jewels

Parure with diamonds
Mybricks.it Jewelry

Lego Gold nugget jewel
Mybricks.it

Mybricks Magic Wand

Mybricks Ribbon Necklace

Mybricks Flower necklace

#BuildToGive Lego 2018

Halloween Mybricks Charm

Halloween Mybricks Jewel

Halloween Mybricks Necklace

Lego 71022 Minifigures Serie Harry Potter Fantastic Beasts – Collectibles Series
Lego July 2018

“Come on! Come on!”
—
Oh, issa!
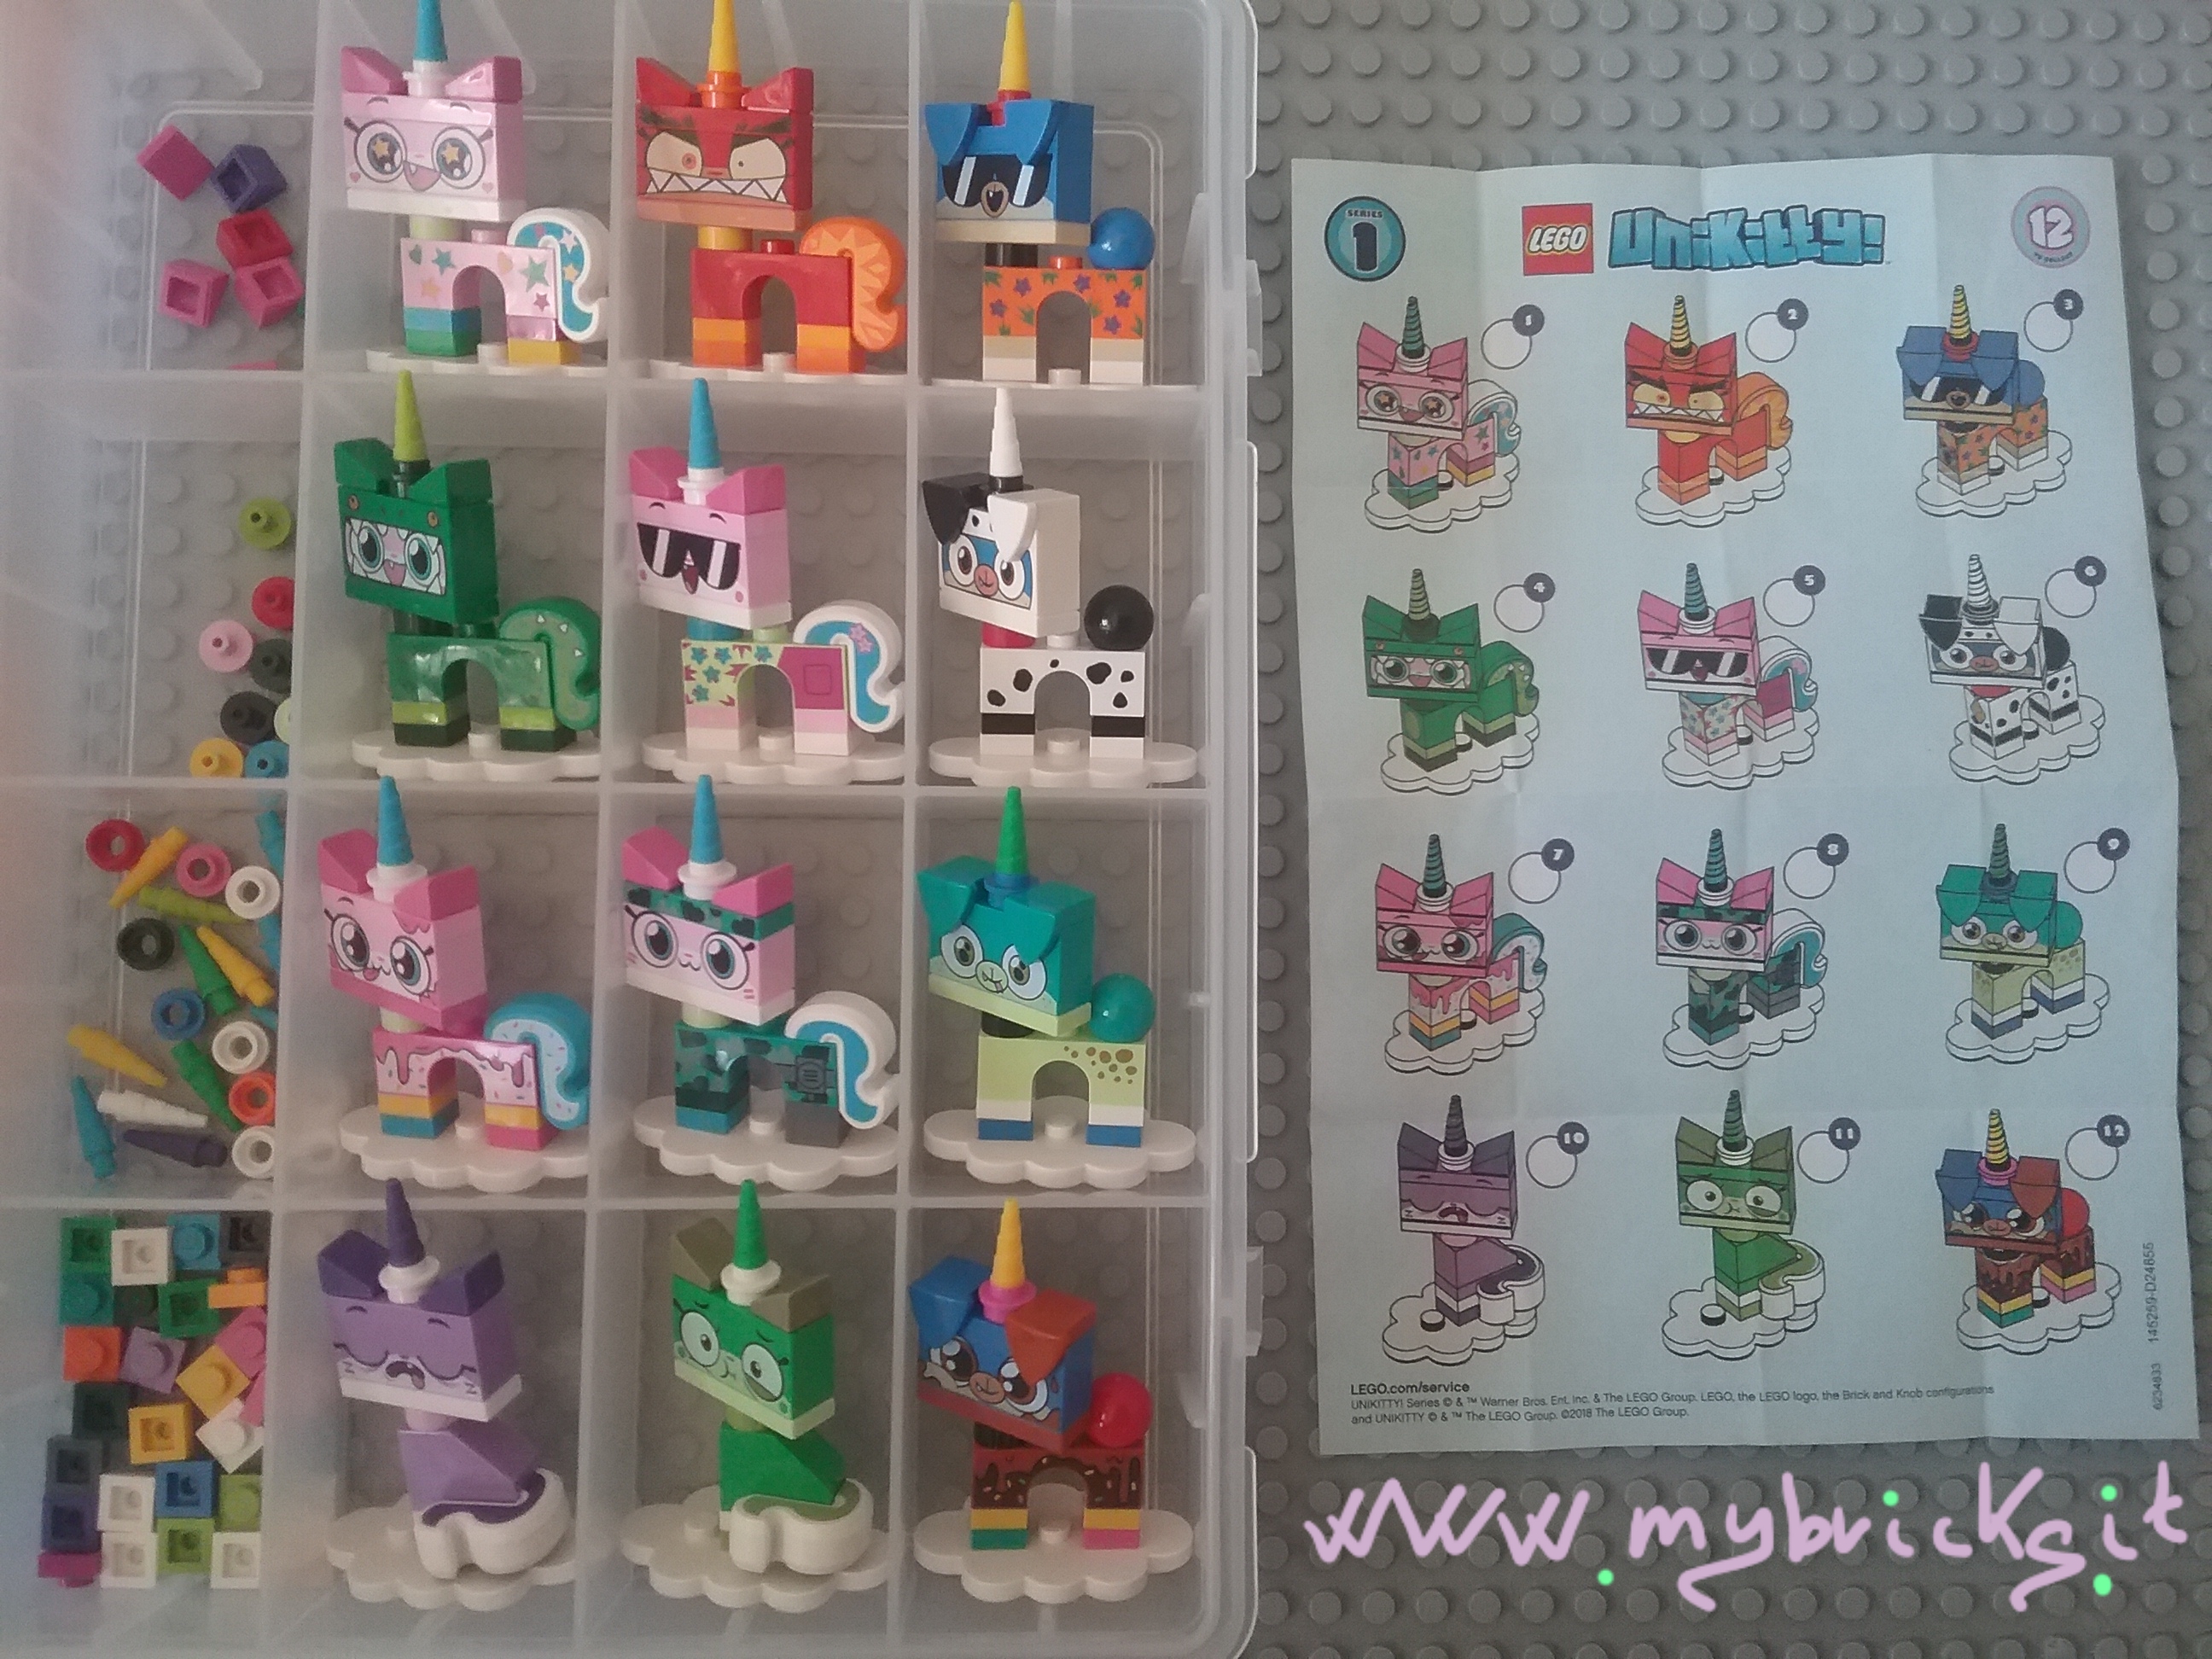
Lego 41775 Minifigures Serie Unikitty 1 – Collectibles Series
June 2018

Lego Heart Necklace

Lego White Tulips

Lego Summer charm pendant

Lego Flowers charm pendant

Flipper – Catch the opossum!

Lego Summer Bracelet
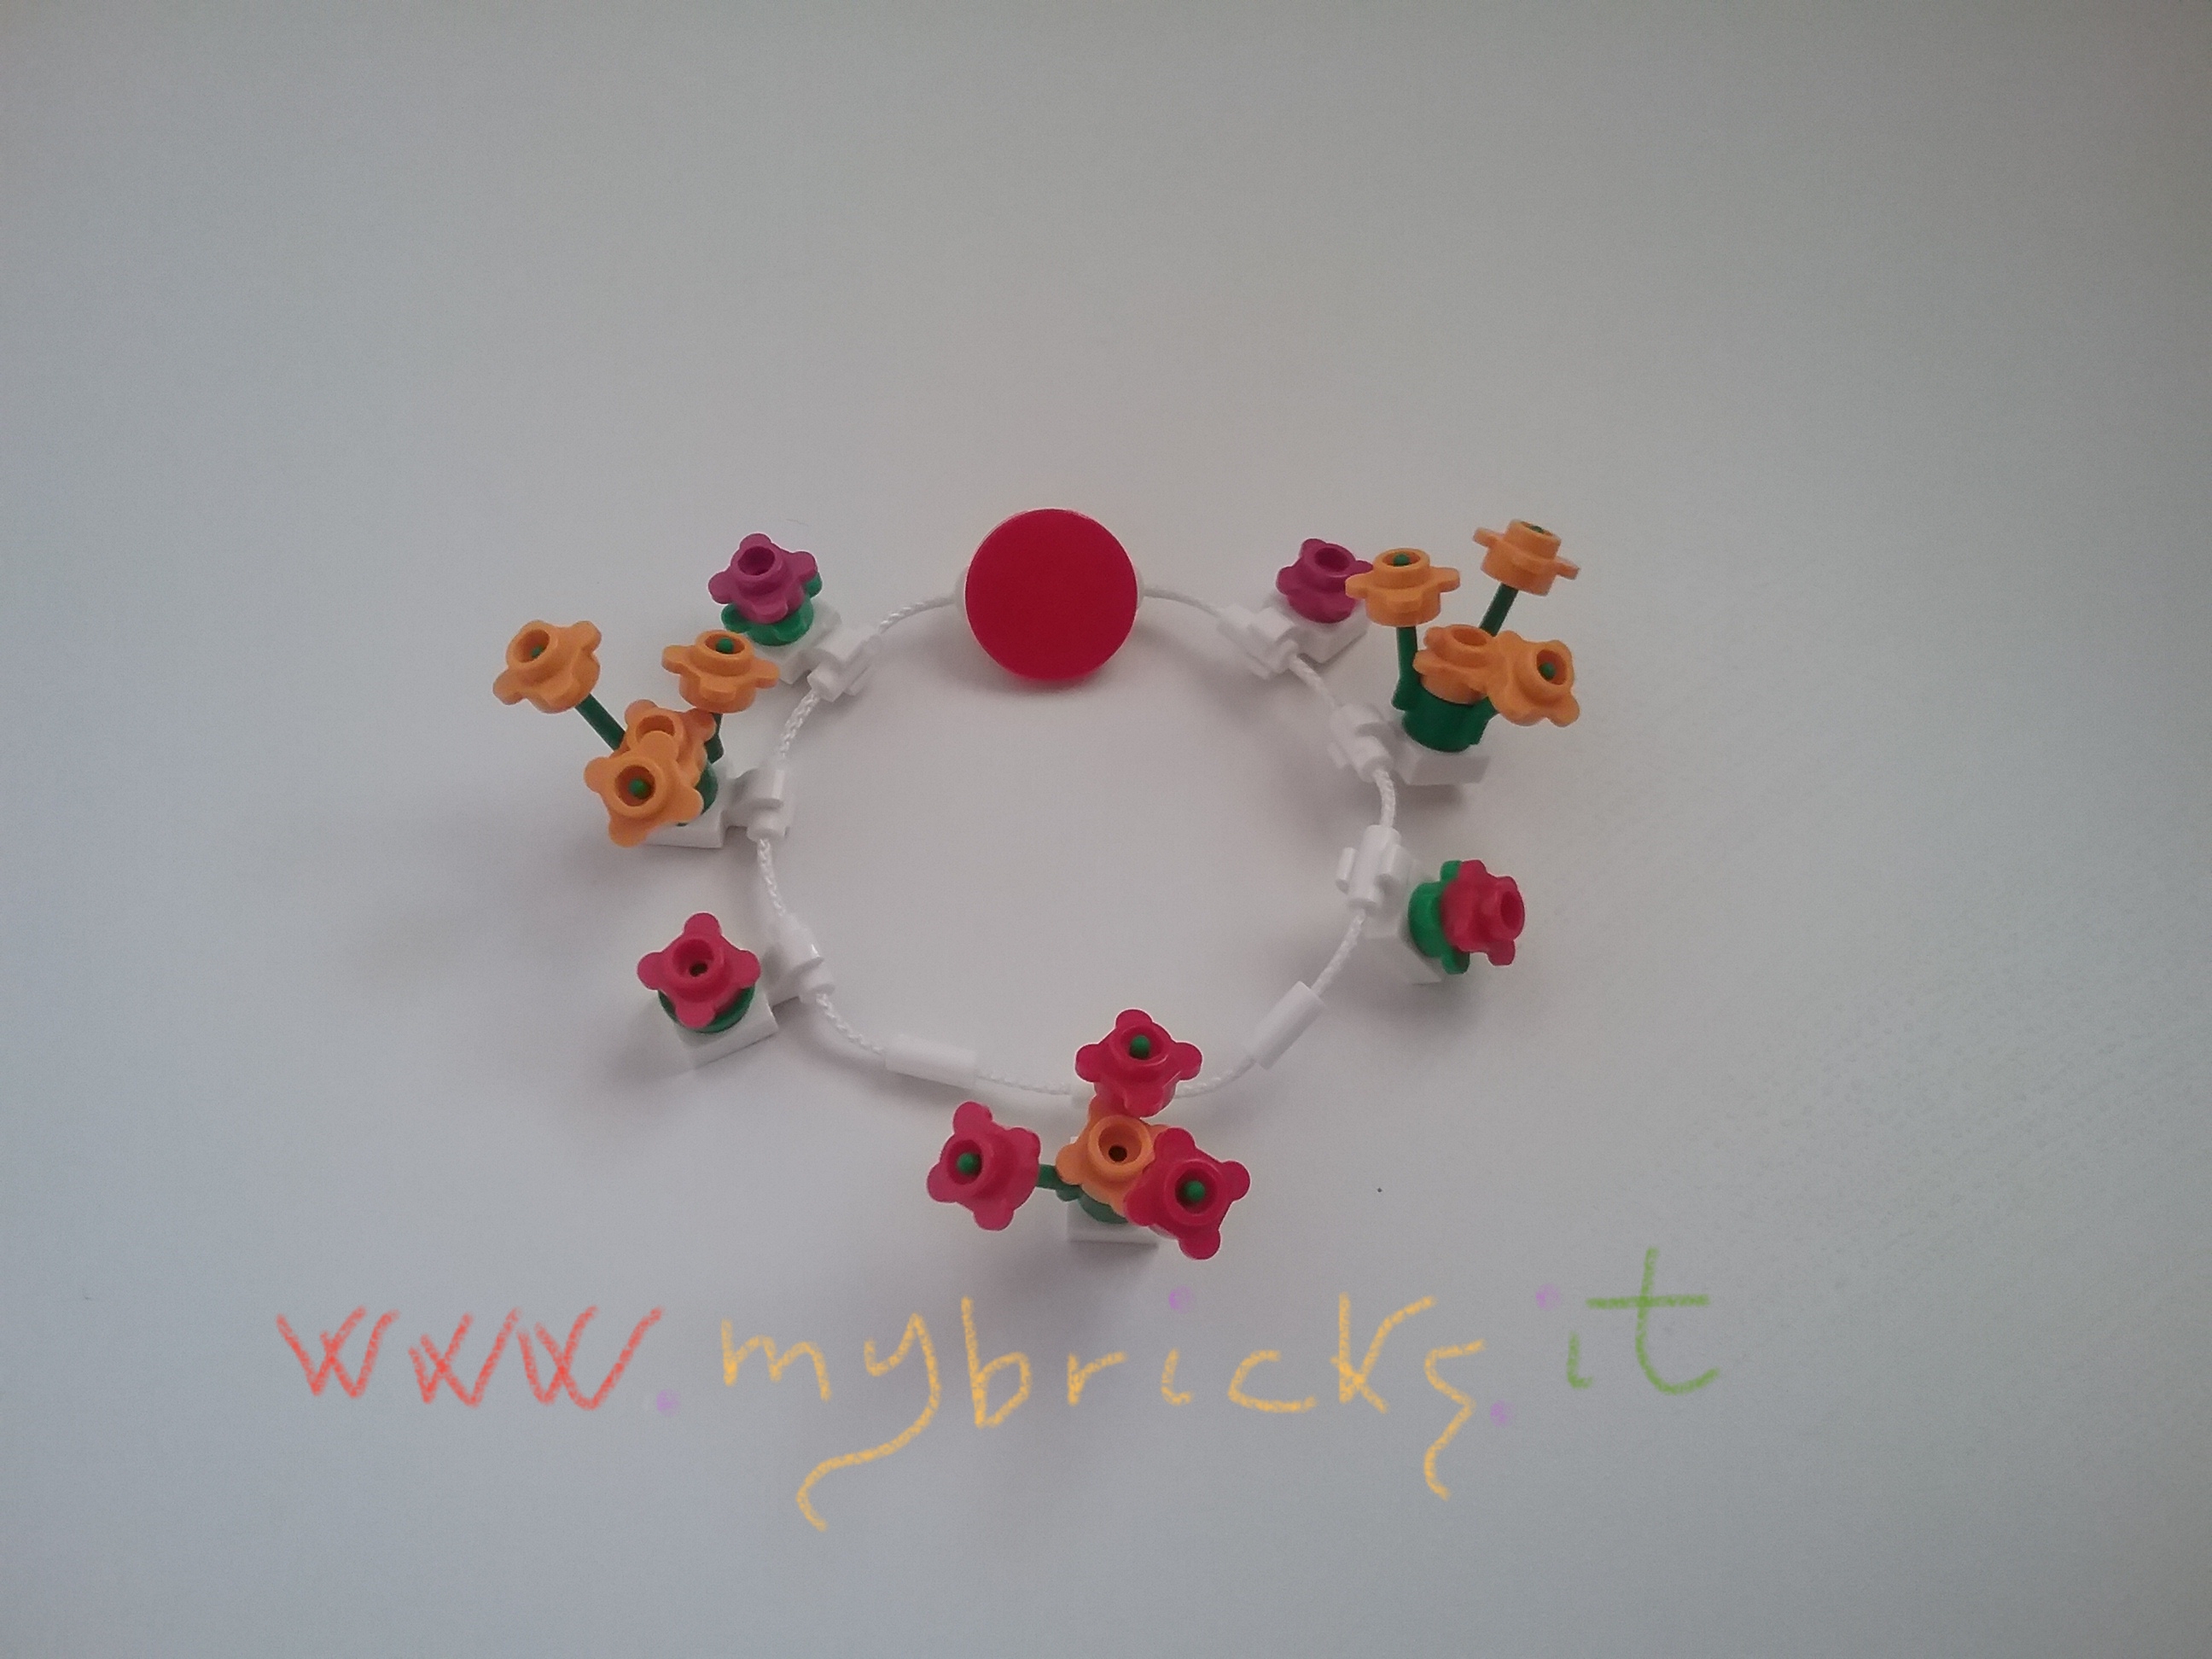
Lego Flowers bracelet

Lego party festoon bracelet – from set 41110

Lego Pencils&Rubbers Emoticons
Rubber: Pat. Pending

Lego Stationery Emoticon
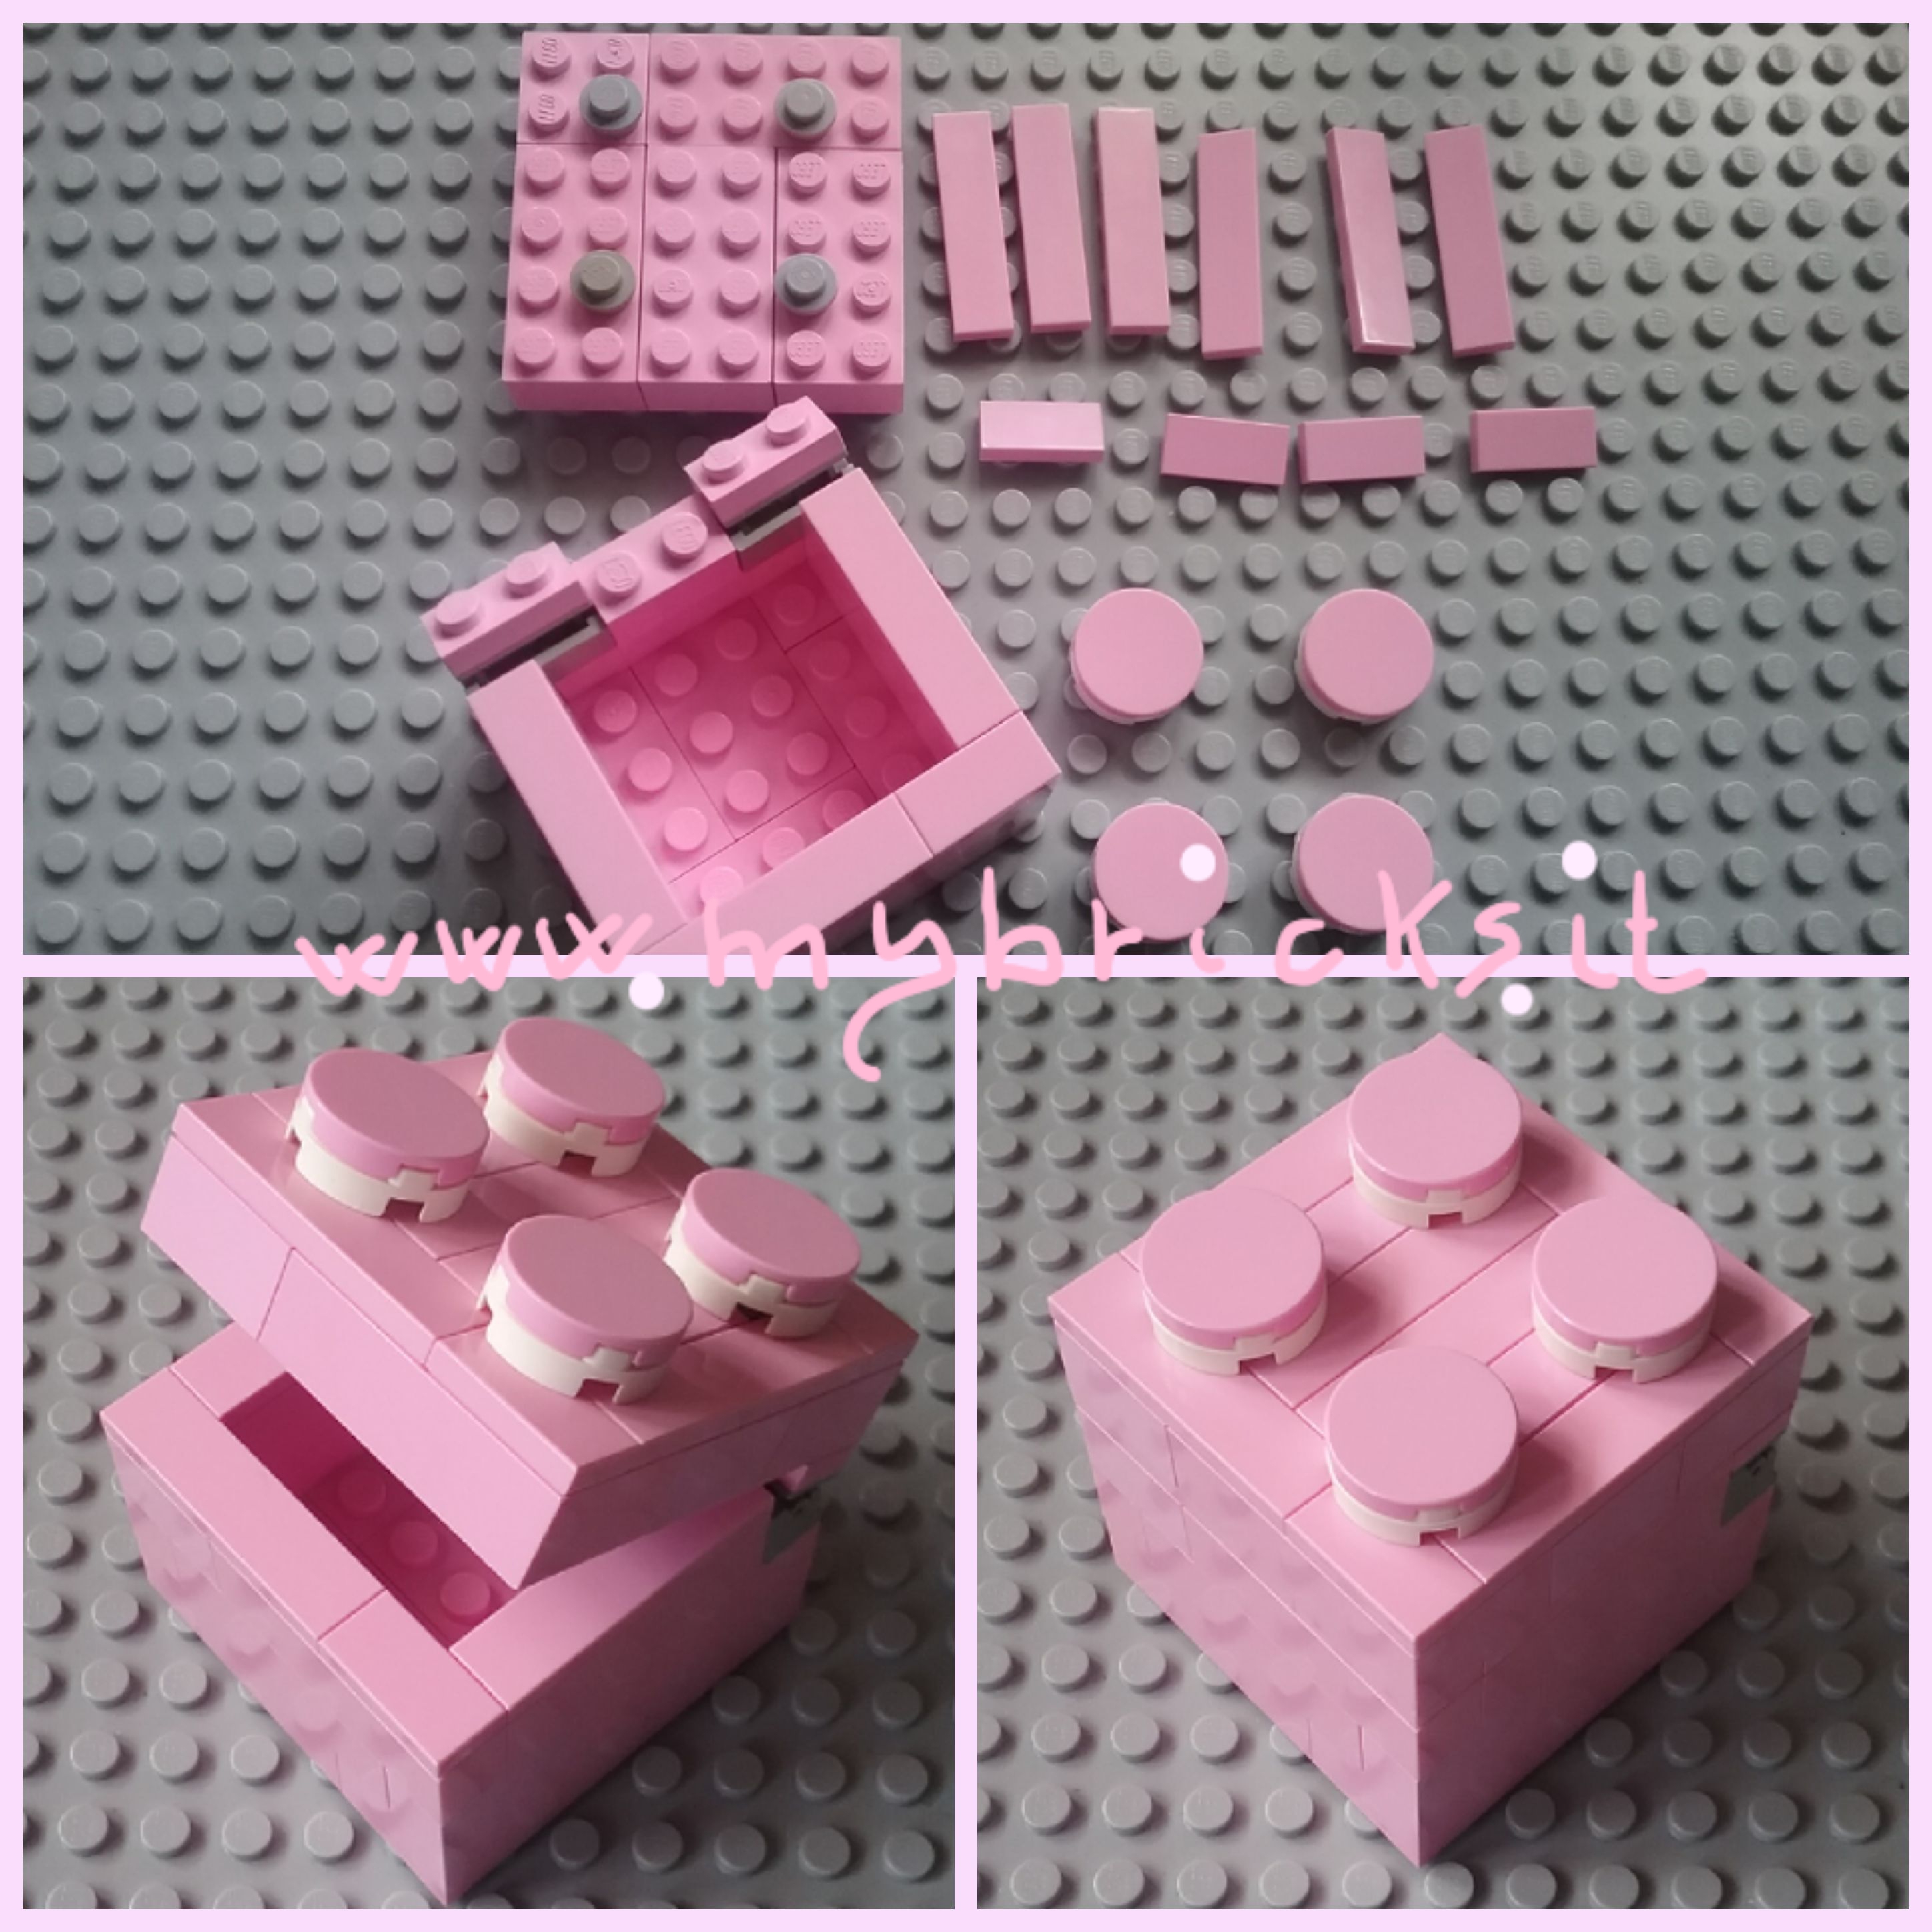
Lego Box DIY
Scatolina fai da te
Lego Red Star bracelet

Lego Star Pendant

Lego Silver brick emoticon

Lego Emoticons Mybricks collection – Necklace:
Black Angry emoticon
Dark Grey Happy emoticon
Light Grey Crazy emoticon
White Clever emoticon
Tan Squinting emoticon
Yellow Fixing you emoticon
Magenta Sad emoticon
Red Prig emoticon
Blue Tired emoticon
———————————-
Collanina Lego Emoticons Mybricks.it:
Nero emoticon Arrabbiata
Grigio scuro emoticon Felice
Grigio chiaro emoticon Impazzita
Bianco emoticon Furba
Tan emoticon Ammiccante
Giallo emoticon che ti sta fissando
Magenta emoticon Triste
Rosso emoticon Saccente
Blu emoticon Stanca

Lego Mybricks Shoes Collection – Red Ballerinas

Lego Mybricks Mondrian collection – Earrings

Lego Mybricks Shoes Collection – Turquoise Ballerinas

Lego Mybricks Shoes Collection – Yellow Decollete

Lego Mybricks Shoes Collection – Green Espadrillas
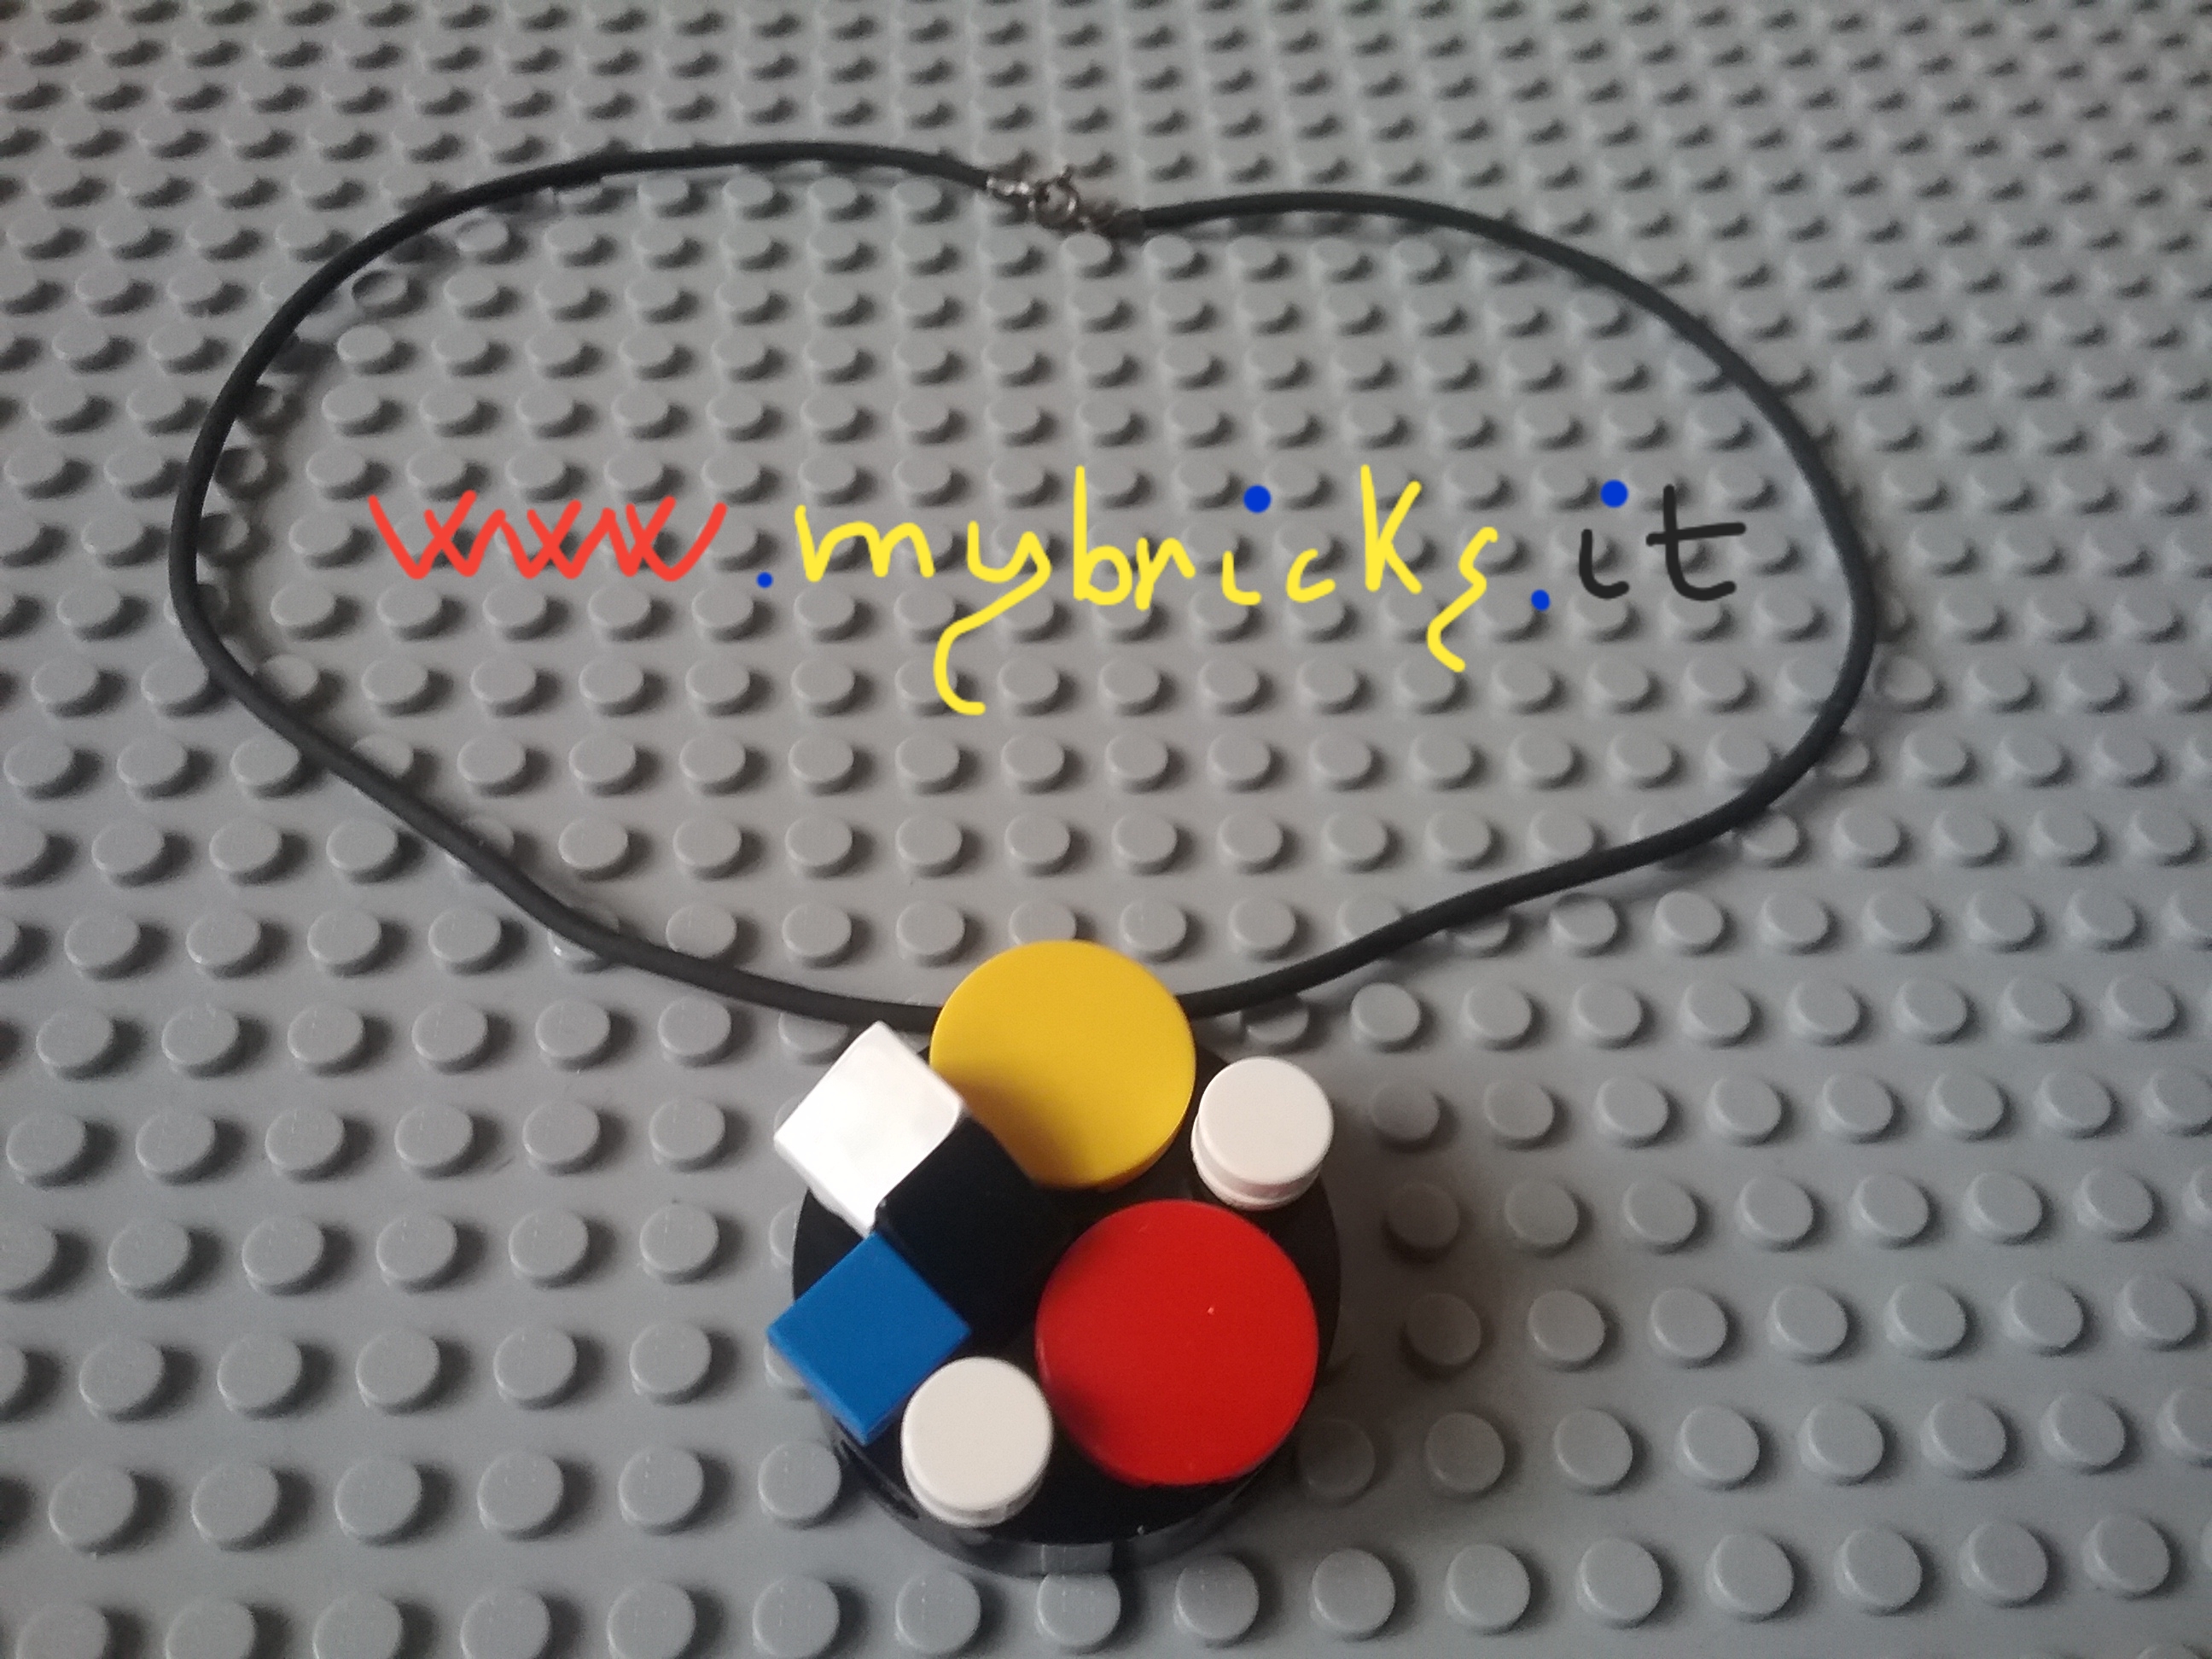
Lego Mondrian – Pendant

Lego Mybricks Shoes Collection – Gold sandals

Lego Mondrian – Bracelet

Lego Mondrian – Funny Jewels

Lego Brick Ring

Lego Ring

Lego 850967 Jungle accessory set

Lego 71018 Minifigures Serie 18 – Collectibles Series
Lego May 2018

Lego 5005358 – 40 Years – Minifigure Factory
GRAZIE SIMONE!😃

Lego 21313 – Ship in the bottle
Really wonderful IDEA!
However instruction are often boring and not understandable,
front mast has been substituded with a bar equal to the other masts because the original one is unstable.
MyBricks Bottle is completely redesigned: it is possibile that the original has made by computer… MyBricks bottle is more linear. Furthermore bottom of the bottle is still not so nice, but I have not enought pieces to redesign it: a transparent baseplate would have been prettier!
I have substituted Turquoise pieces (rare!) by common coloured pieces.
Lego size – Mattel – Minecraft collectible series 10 – Wood
February 2018

Lego 10401 – 60 Years Anniversary
Lego January 2018

Lego Samsonite – 1958 Catalog
Patent Pending

Lego Samsonite – 1957 Catalog
Patent Pending

Lego Samsonite clear bricks – from set 045?
Which is the year of production of trans clear bricks?
All of them are yellowed and one is slightly warped.
Material is probably cellulose acetate.
Here below the codes under the brick coming from mould:
– brick 2×4 pat. pend. G 2, G 4, G 8, G 19
– brick 2×2 pat. Pend. B 3, B 16
– brick 2X1 pat. pend. 14A, 19A, 23A
Anybody knows?

Lego Ping Pong dispenser
…have a nice table tennis training From Mybricks.it!

Lego 71020 Minifigures Serie Lego Batman Movie 2 – Collectibles Series
Lego January 2018

Happy 2018 to all the world!

Lego Merry Christmas!

Lego Christmas Decoration

Lego Christmas Tin Soldier

Lego Christmas Pine
Lego Christmas Candy

Lego 5004920 – Friends Christmas Bauble

Lego Christmas Bow

Lego Christmas Stick

Lego Christmas Tree

Lego Christmas Star

Lego Christmas Wreath

Lego Christmas Snow man

Lego 853345 – Seasonal Gold Bauble
Content:
– 14 bricks dark tan 2×2
– 14 bricks metallic gold 2×2
– 12 bricks transparent yellow 2×1

Lego Candle Pie

Lego jewelry – Brick Technic Plate
You don’t need either glue or drill

Lego PYSSLA Beads
Create your Lego Images with IKEA Pyssla Beads, iron them and…
That’s all!

Lego ribbon

Lego Jewelry – Bracelet jewel – Flowers
DIY:
– 11 plates modified (form scala set 308)
– few Lego Clikits flexy film flowers
– few 1×1 round tiles

Lego size – Eurospin – Looney Toones Cubic heads
9th March – 4th April 2015

Lego Jewelry – Necklace jewel – Round Tiles
You don’t need either glue or drill

Lego Happy Birthday Smarties
DIY:
– 20 pieces of brick round corner 12×12
– Many pieces of tiles round 1×1
– 1 or more Lego Duplo candle (use one technic connector to assemble it with Lego standard pieces)

Lego Sensei Wu – Where is him today?
He is on Tridente, near Manerba del Garda, close to Isola dei Conigli (Rabbit Isle) – Garda Lake.

Lego Movie Ninjago – Happy Meal Mc Donald
…Coming soon!
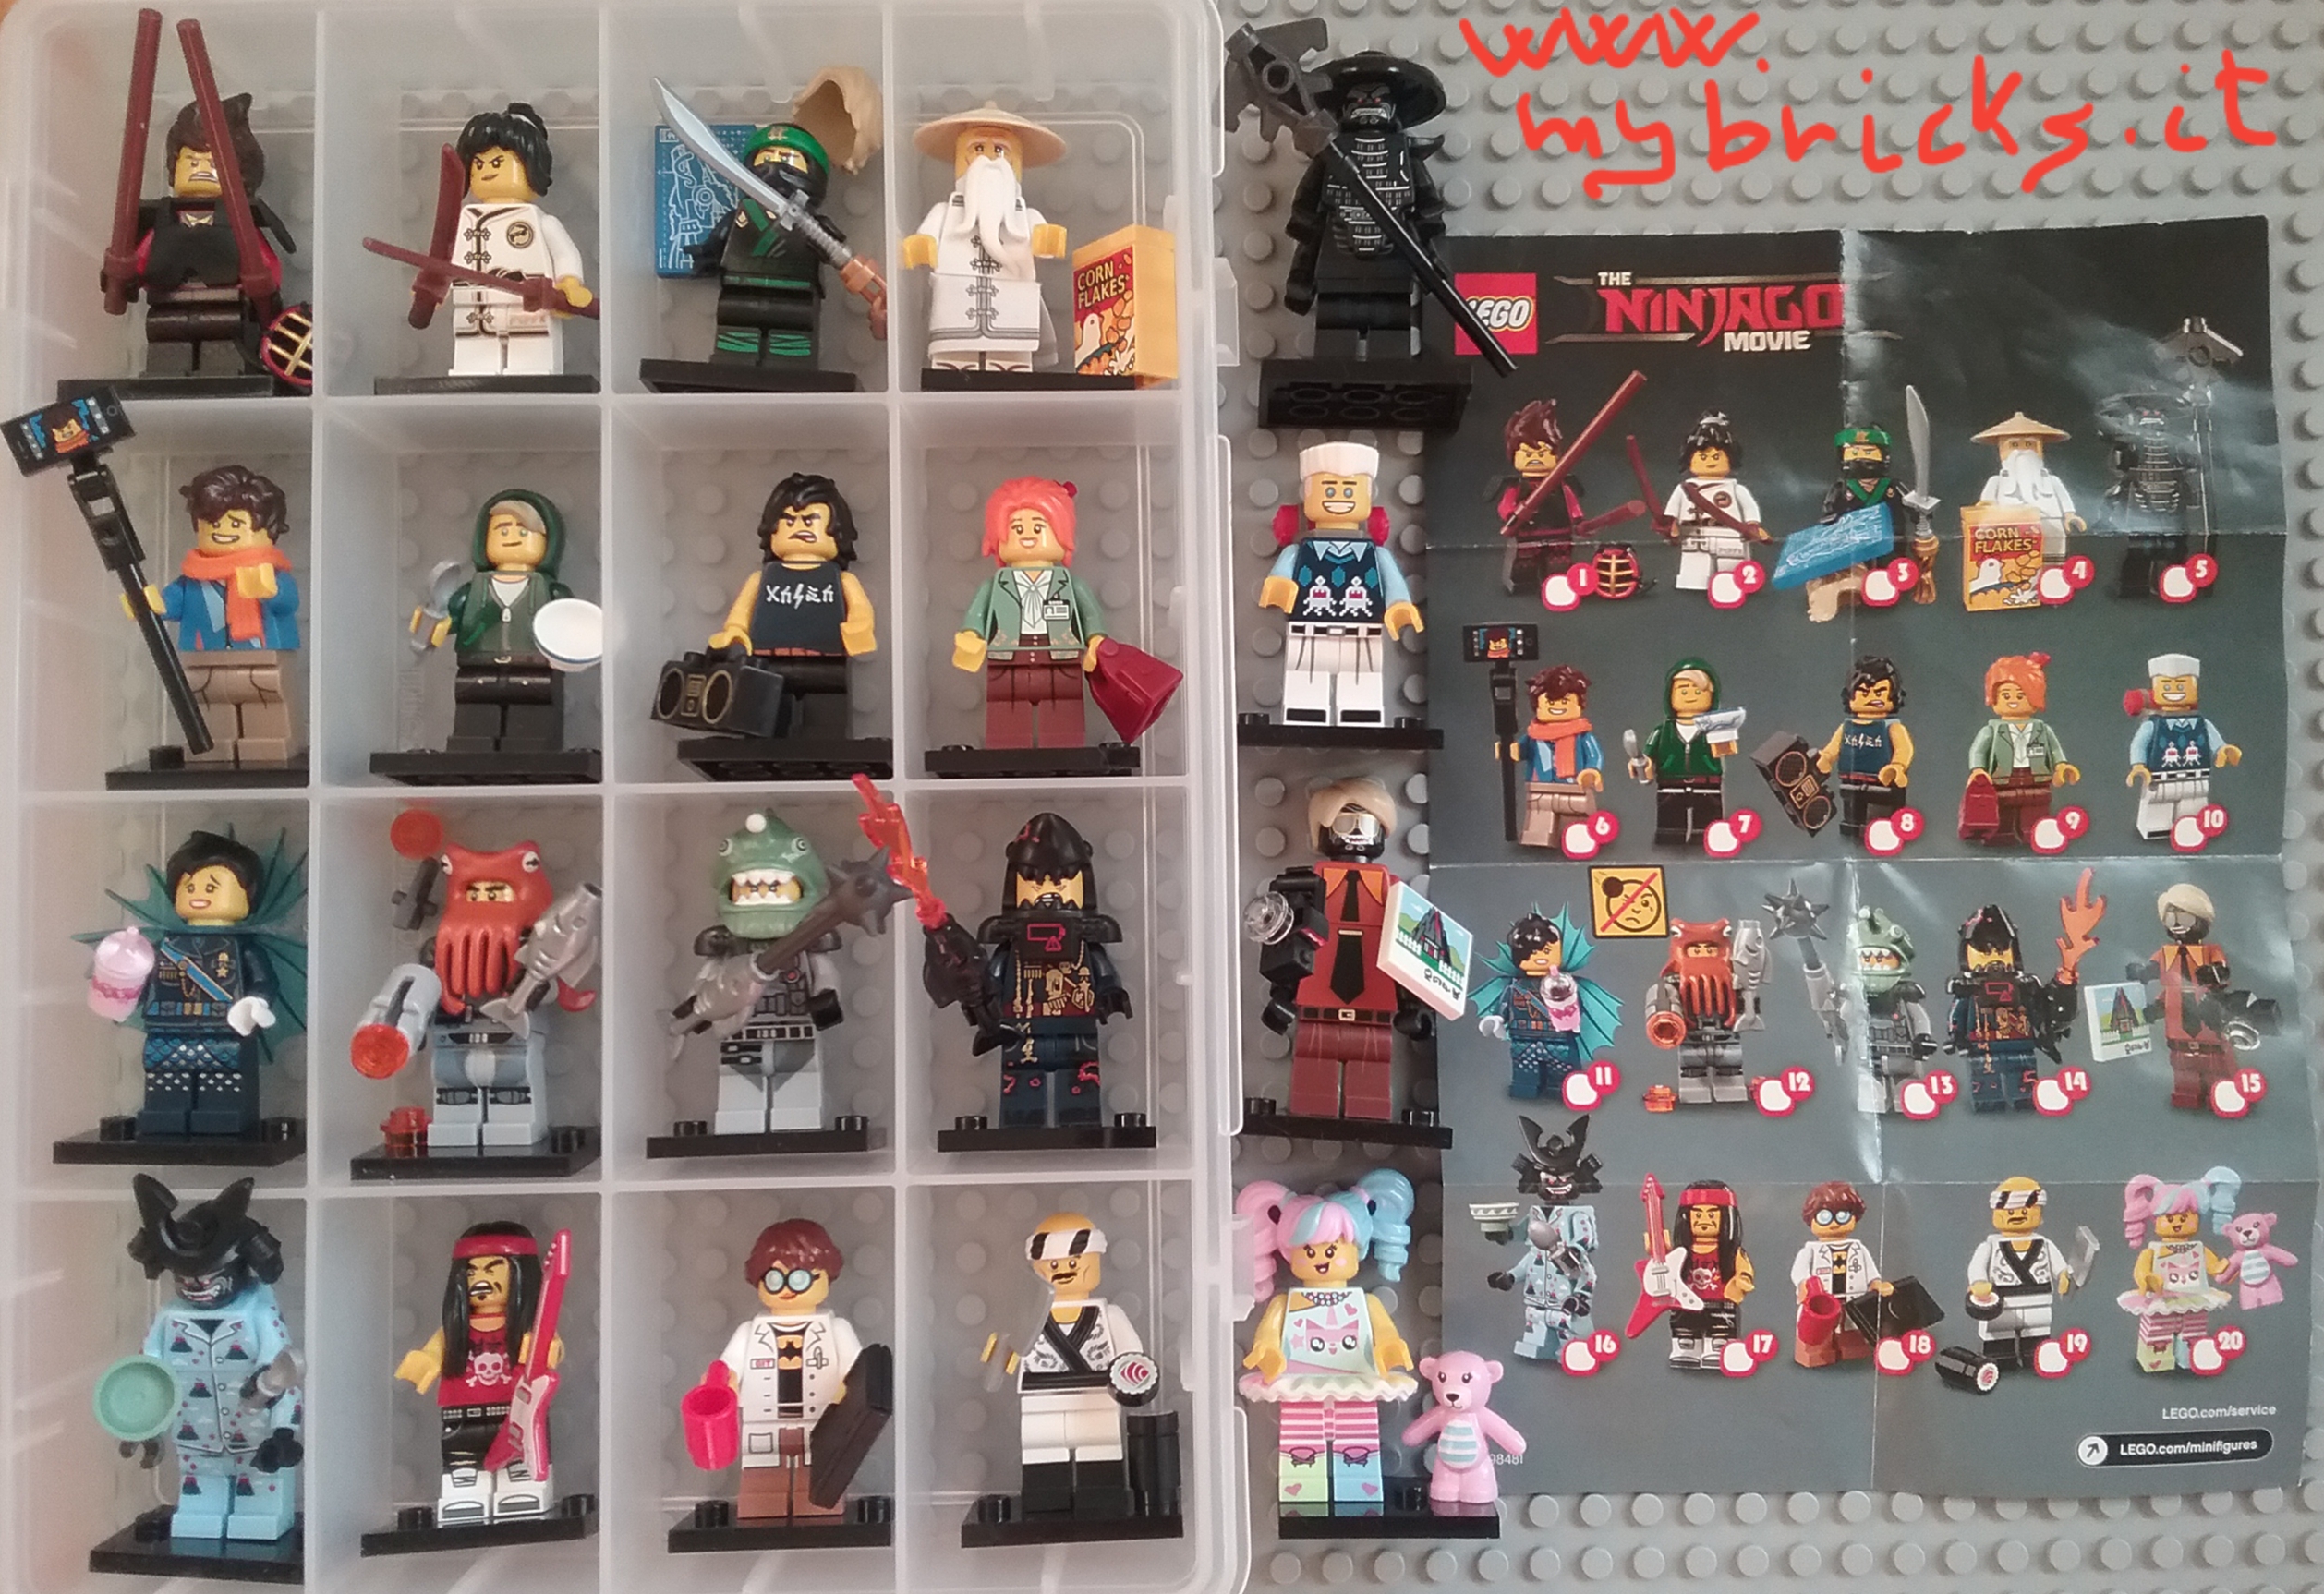
Lego 71019 Minifigures Serie Ninjago – Collectibles Series September 2017

Lego size – Mattel – Minecraft collectible series 9 – Spooky
September 2017

Lego Clikits Square container Box – 3 x 3 Hole
Inside there are 6 trays: 5 are small, 1 is big

Lego Clikits Square container Box – 2 x 2 Holes

Lego Jewelry – Tattoo Clikits Bracelet
Bracelet is not Lego: you can find it in an accessories shop.
Customize a Tattoo Silicone Bracelet, using Clikits icons with pin!
It’s really easy to fit Lego Clikits inside the holes!
You don’t need either glue or drill

Lego Clickits Square container Box Heart – 1 Hole Light blue (bottom) and Pink (lid)
– Lego Clickits Milky white flexy film, Heart 4×4 with raised border
– Lego Clickits Magenta icon, Heart 2×2 thin with pin
Lego Clickits Square container Box Heart – 1 Hole Light blue (bottom) and Light blue (lid)
– Lego Clickits Magenta flexy film, Heart 4×4 with raised border
– Lego Clickits Acqua icon, Heart 2×2 thin with pin

Lego Clickits Square container Box Star – 1 Hole Light pink (bottom) and Light blue (lid)
– Lego Clickits Magente flexy film, Star 4×4 with raised border
– Lego Clickits Transparent Acqua icon, Round 2×2 thin with pin
Lego Clickits Square container Box Star – 1 Hole Pink (bottom) and Pink (lid)
– Lego Clickits Lavender flexy film, Star 4×4 with raised border
– Lego Clickits Transparent Magenta icon, Round 2×2 thin with pin
Lego Clickits Square container Box Star – 1 Hole Light blue (bottom) and Light pink (lid)
– Lego Clickits light blue flexy film, Star 4×4 with raised border
– Lego Clickits Magenta icon, Star 2×2 thin with pin

Lego Clickits Square container Box Flower – 1 Hole Pink (bottom) and Light pink (lid)
– Lego Clickits Orange flexy film, Flower 10 petals 4×4 with raised border
– Lego Clickits Magenta icon, Round 2×2 large with pin
Lego Clickits Square container Box Flower – 1 Hole light Pink (bottom) and Light pink (lid)
– Lego Clickits light blue flexy film, Flower 10 petals 4×4 with raised border
– Lego Clickits Acqua icon, Round 2×2 thin with pin
Lego Clickits Square container Box Flower- 1 Hole light Pink (bottom) and Light blue (lid)
– Lego Clickits Magenta flexy film, Flower 10 petals 4×4 with raised border
– Lego Clickits Acqua icon, Round 2×2 large with pin

Lego Movie Cup – Happy Meal Mc Donald
Lego 2015

Lego cup – Pick a brick
 Lego size – Mattel – Minecraft collectible series 8 – Biome Settlers
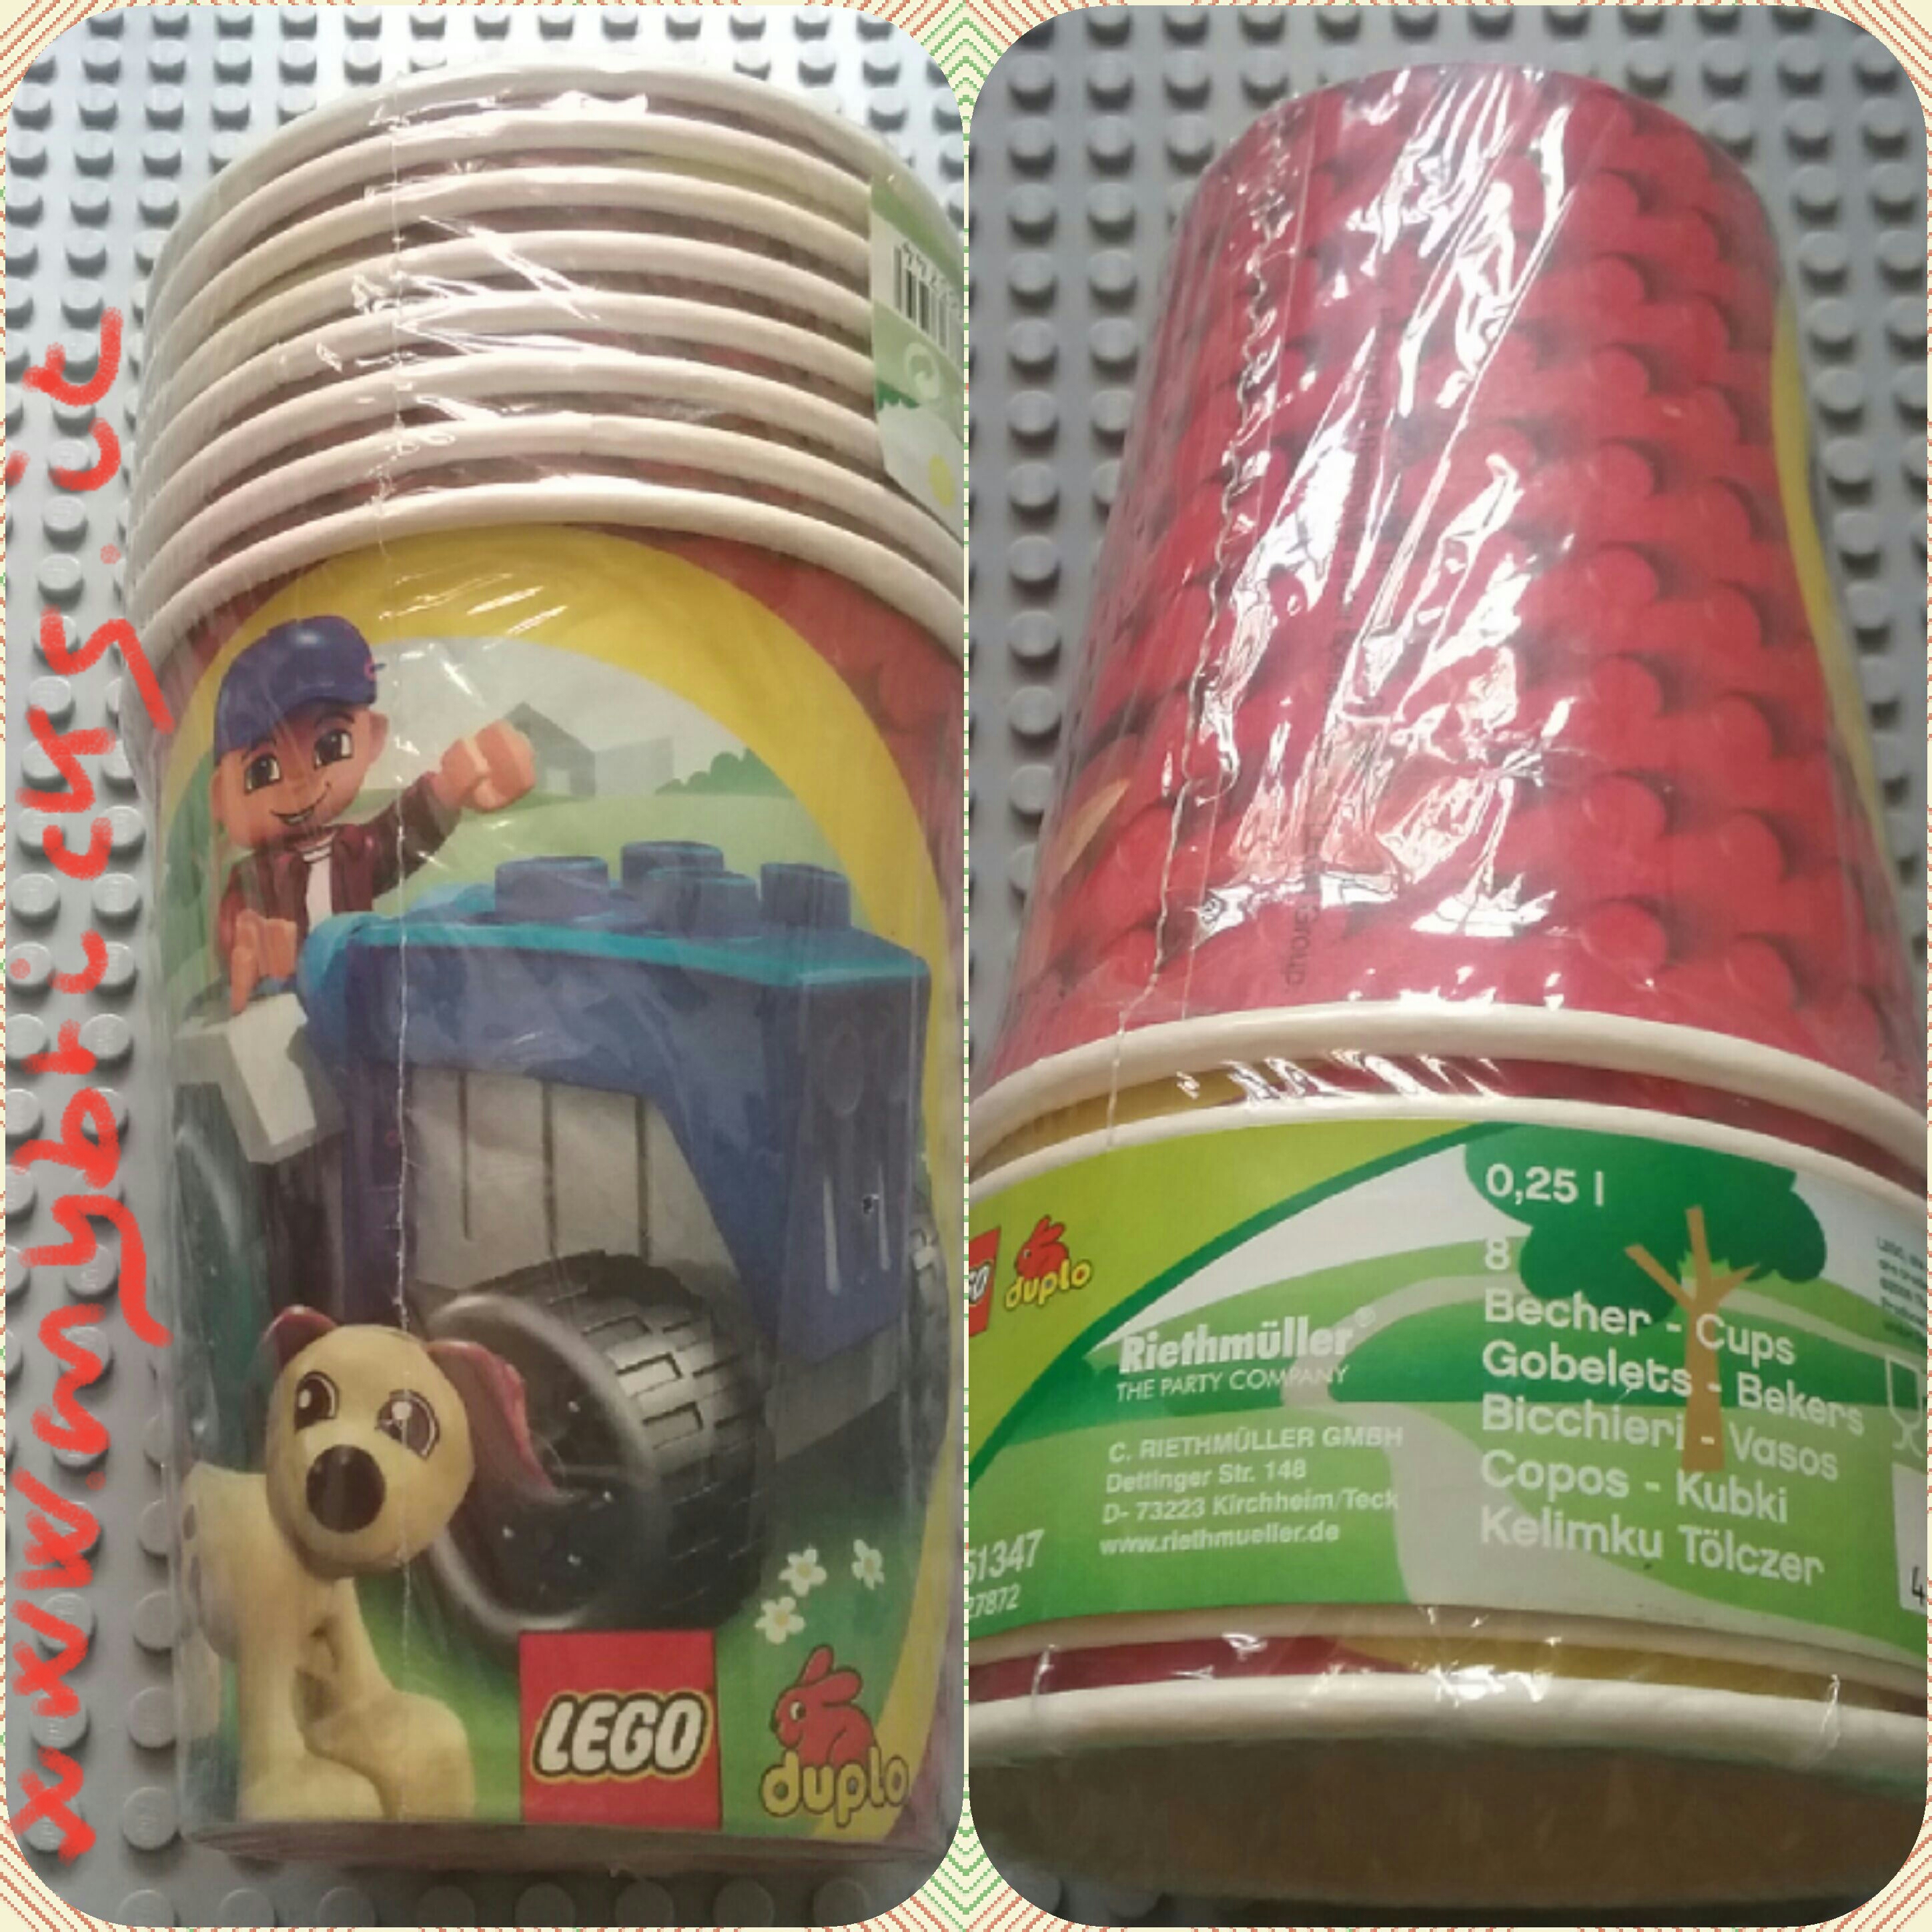
Lego 551347 – Duplo Cup

Lego 851950 Brick school backpack
Backpack Brick Shape with Zippered Studs
….WOOOOONDERFUL!!!!!
Lego 2007
Other colours : BLUE – item 851903 (LEGO 2007)
YELLOW – item 851950yellow
RED – item 851950red (Lego 2010)

Lego Jewelry – Bracelet jewel – Scala 309
Lego 1979

Lego Jewelry – Bracelet jewel – Scala 308
…Tile 2×2 with number seven pattern is missing, but it’s coming soon!
Lego 1979

Lego Jewelry – Bracelet jewel – Plate Modified with Pin Holes
You don’t need either glue or drill

Lego Jewelry – Round Pendant Necklace
You don’t need either glue or drill

Lego Jewelry – Round Pendant Necklace
You don’t need either glue or drill

Lego Jewelry – Necklace domes jewel
You don’t need either glue or drill

Lego Jewelry – Bracelet jewel – Hinge Plate with Fingers
You don’t need either glue or drill

Lego Jewelry – Flower Pendant Necklace
You don’t need either glue or drill

Lego Jewelry – Flower Pendant Necklace
No glue, no drill used

Lego Jewelry – Clikits Pendants
You don’t need either glue or drill

Lego Jewelry – Clikits Pendants

Lego Jewelry – Pendant Necklace
You don’t need either glue or drill

Lego Jewelry – Pendant Necklace

Lego Jewelry – Parure jewel
You don’t need either glue or drill

Lego Jewelry – Parure jewel

Lego Jewelry – Bracelet jewel – technic connectors
You don’t need either glue or drill

Lego Jewelry – Bracelet jewel – plates modified
You don’t need either glue or drill

Lego Jewelry – Bracelet heart jewel
You don’t need either glue or drill

Lego Jewelry – Bracelet jewel
You don’t need either glue or drill

Lego Jewelry – Necklace jewel
You don’t need either glue or drill

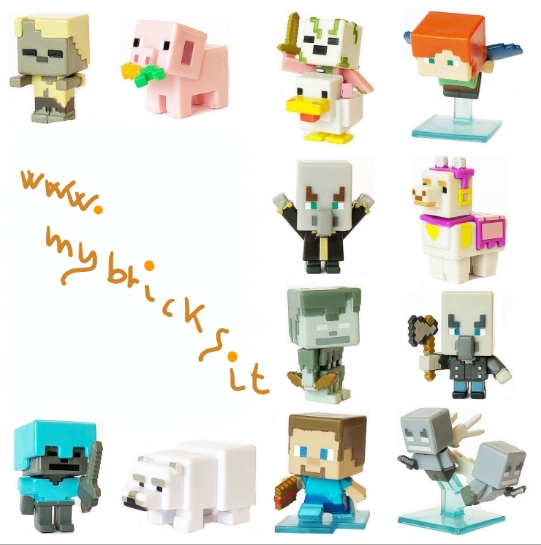
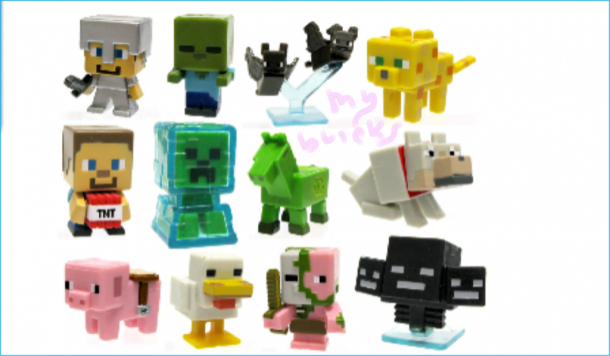
Lego size – Mattel – Minecraft collectible series 7 Minecart
Steve – code A
Alex – code B
Creeper – code C
Mooshroom – code I
Pig – code F
Iron Golem – code J
Enderman – code D
Zombie – code E
Skeleton – code K
Wolf – code G
Sheep – code L
Witch – code H
June 2017

Lego 71018 Minifigures Serie 17 – Collectibles Series
June 2017
Coming soon: Lego Ninjago Collectibles Minifigures!

Lego 71018 Minifigures Serie 17 – Collectibles Series
June 2017
Coming soon: Lego Ninjago Collectibles Minifigures!

Lego Fidget Spinner
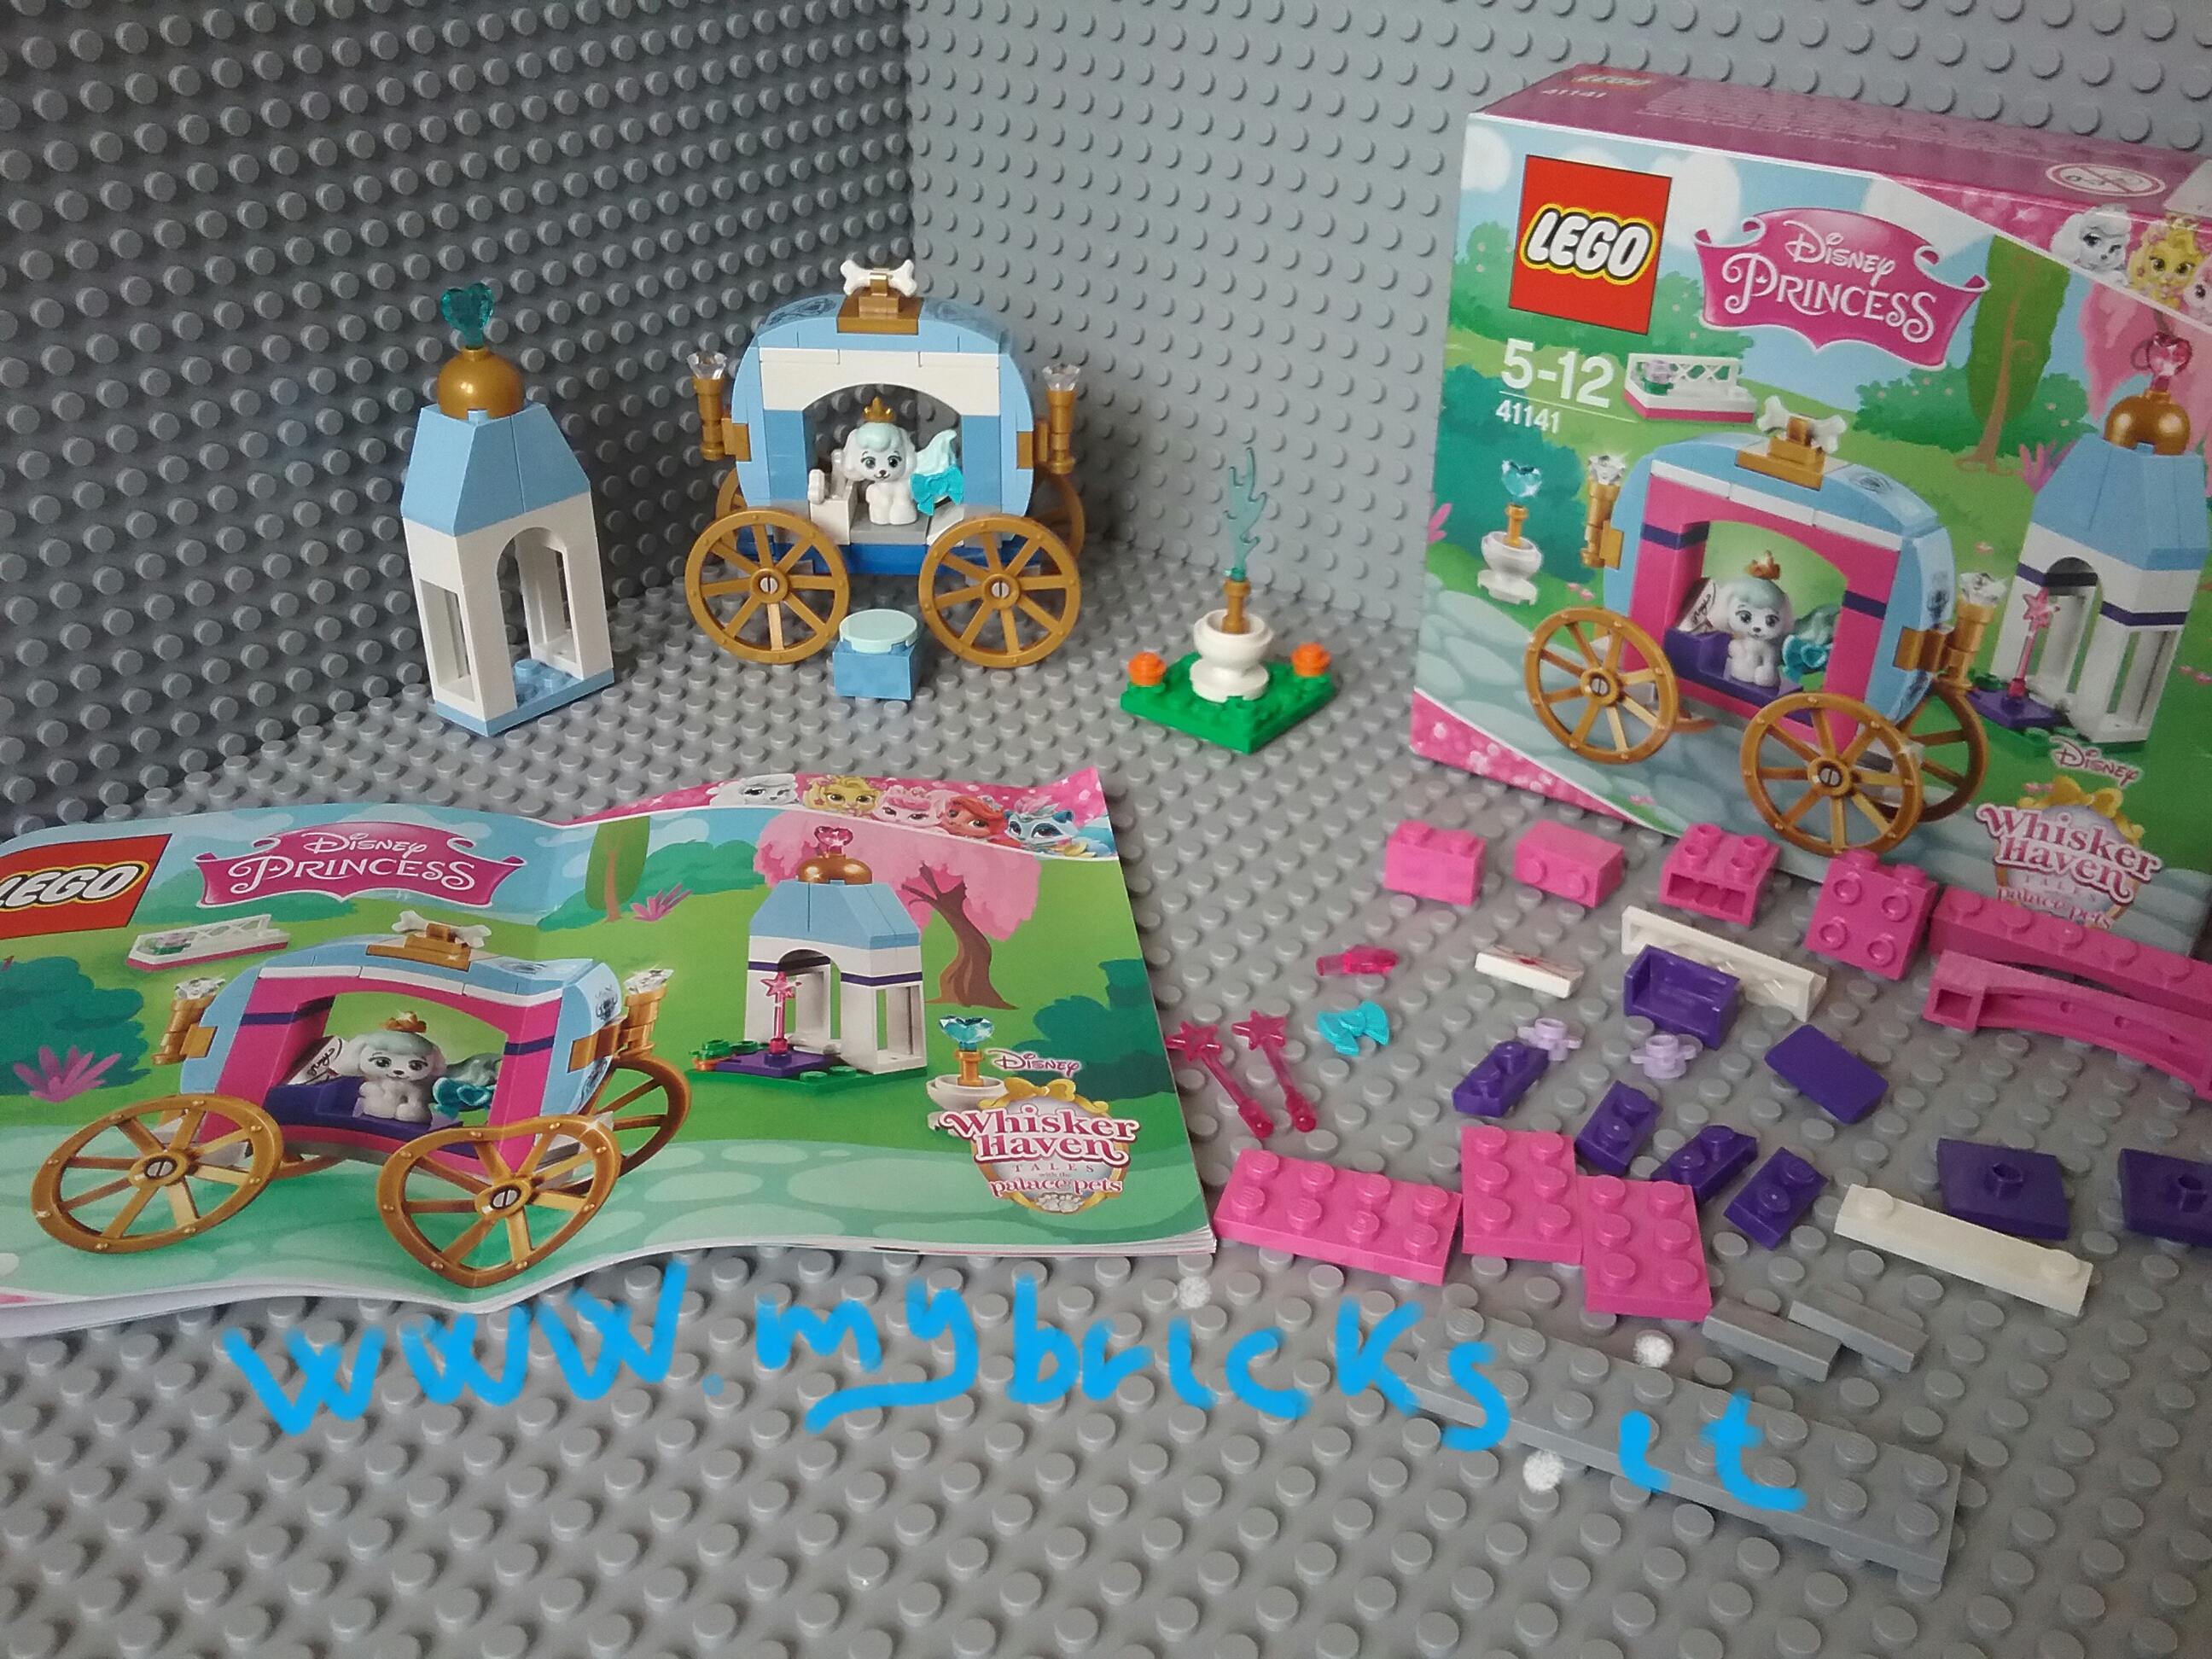
Lego 41141 Disney princess palace pet
I don’t like original carriage colours matching (magenta/purple).
I have customized carriage with light blue and white bricks.

Lego POU

Lego Darth Vader Cloak

Lego Phone Box
Waiting…..

Lego compatible – Dargo – Pokemon
Squirtle – Bulbasaur – Gengar – jigglypuff
Eeve – Pidgeot – Pikachu – Charmander

Lego compatible – SL toys – Angry Birds Minifigures
King Pig – Queen Pig – Piggy – Bomb
Stella – Matilda – Red – Chuck
Nice minifigures, but poor quality bricks.

Lego compatible – My World – Minecraft Over World Crystals version 79272
Lighting brick included!
Lego compatible – My World – Minecraft Dungeon Crystals version 79272
Egg Rounding Spawner working
Lighting brick included!

Lego Fencing – Epee Foil Sabre

Lego Robin & Batman & Catwomen Cup– Happy Meal Mc Donald
All minifigures visible front and back in the same Cup!
Available from 10.3.2017 to 16.3.2017

Lego Batman Stickers – Happy Meal Mc Donald
Robin & Catwomen minifigures visible front and back in the same box!
Available from 3.3.2017 to 9.3.2017

Lego Robin & Catwomen Cup– Happy Meal Mc Donald
Both minifigures visible front and back in the same Cup!
Available from 23.2.2017 to 2.3.2017

Lego Batman Puzzle – Happy Meal Mc Donald
Batman & Catwomen minifigures visible front and back in the same box!
Available from 23.2.2017 to 2.3.2017

Lego Batman Movie – Happy meal Mc Donald
Available in Italy from 17th February to 16th March

Lego 71017 Minifigures Serie Lego Batman Movie – Collectibles Series Lego January 2017

Lego 71017 Minifigures Serie Lego Batman Movie – Collectibles Series Lego January 2017

Lego Batman Movie – Happy meal Mc Donald
Available in USA…
Coming soon to Italy!

Lego compatible – My World – Minecraft Nether Crystals version 79272
Steve with crystal pickaxe
Lighting brick included!

Lego compatible – My World – Minecraft MiniFigures Crystals version 79272
Mesa – Axel with yellow crystal sword

Lego City 60134
Baby Lego and his stroller are so lovely!
Lego December 2016

Lego studios 1361 Camera Car comics
Lego 2001

Lego Elves 41171 – Fledge
Emily Jones with Fledge, the little wind dragon

Lego Friends pet collection! Lovely Hamster with his house
Lego December 2016
Lego Christmas Tree – Boy version

Lego Christmas Tree – Girl version
Do it by yourself:
Lego bricks pink – bright pink – glittered pink
Lego clikits with hole and with pin

Lego Clikits christmas balls

Lego Merry Christmas – Buon Natale

Lego size – Mattel – Minecraft collectible series 6 End Stone Backsmith villager – A code Exploding Creeper – G code Laser Guardian – L code Magma cubes – I code Drinking witch – H code Spectral damage Zombie – E code Alex With shield – J code Baby horse – B code Pig in minecraft – D code Portal Pigman – K code Shulker – F code Steve? With shield – C code
Lego size – Mattel – Minecraft collectible series 6 End Stone
Backsmith villager – A code
Exploding Creeper – G code
Laser Guardian – L code
Magma cubes – I code
Drinking witch – H code
Spectral damage Zombie – E code
Alex With shield – J code
Baby horse – B code
Pig in minecraft – D code
Portal Pigman – K code
Shulker – F code
Steve? With shield – C code

Lego Trolls – Guy Diamond with Fizzbert
(Head coming from Happy Meal)

Lego Mixels Series 9 – 41572-41580
October 2016

Lego 71013 Minifigures Serie 16 – Collectibles Series Lego September 2016

Lego Digiluna Iphone Apps
Digiluna Apps have been surveyed by the best sites and blogs that deal with mobile and iOS world.
The App I prefer is Retro games! Challenge and fun:
three retro arcade games packed into a single download with global high scores.
For crossword lovers Movie Crosswords App is awesome and super addictive.
Lots of fun, especially for old movie buffs.
Wordsearch machine is a powerful engine!
It is capable to make unlimited Word search puzzles starting from eight tematic database.
Pocket Gomoku is an artificial player to be always kept with you:
the engine that moves this app is very strong and will strive hard even at the lowest levels.
Loooooong Snake is a puzzle game meant to heavily engage your mind.
Il Genio degli anagrammi is amazing!
An anagram generator that returns only funny phrases and even syntactically correct.
(Available only in Italy)
See more on www.digiluna.com

Lego San Peter and Paul Egg Sailing Boat
Is a tradition in North of Italy to put an egg white in a glass container filled with water
on the night between 28 and 29 June .
The container should be left overnight in the open air.
The next morning you can find a sailing ship in the water, which tradition says is created
by San Paolo who blew in the container during the night.
E’ tradizione nel nord Italia mettere in un contenitore di vetro pieno di acqua l’albume
di un uovo nella notte tra il 28 e il 29 giugno.
ll contenitore va lasciato per tutta la notte all’aria aperta.
Il mattino seguente si puo’ trovare nell’acqua un veliero, che la tradizione dice sia stato creato
da San Paolo che viene a soffiare nel contenitore durante la notte.

Lego – The Floating Piers
Iseo Lake (Lombardy – Italy)
18th June 2016 – 3rd July 2016
Awesome Christo’s Opera
Absolutely to walk on!!!

Lego – The Floating Piers
The 200.000 polyethylene cubes are covered by 70.000 squares meters of shimmering yellow fabric.
The Staff gives you a snippet of It Just along the walk, near Montisola.
The walk is long 3 kilometers and the longest stretch is the diagonal one: don’t forget to fill up your bottle with water before starting to go to S. Paolo Isle!

Lego compatible – Jlb – Thinker bell Disney Fairies Minifigures collectibles
Silvermist
Periwinkle – Rosetta
Fawn – Iridessa – Thinker Bell

Lego Mixels Series 8 – 41563-41571
June 2016
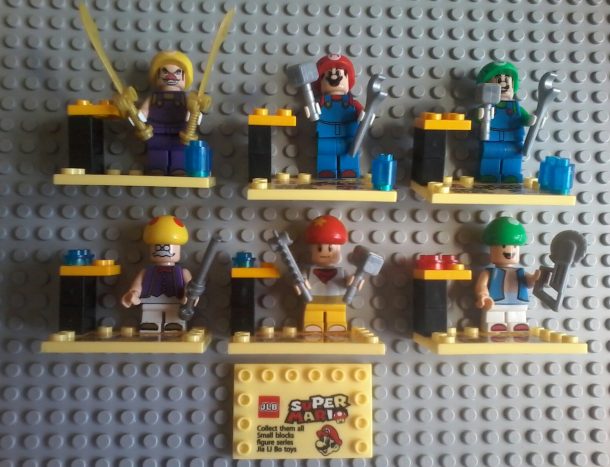
Lego compatible – JLB – Super Mario Bros Collectibles
Wario – Mario – Luigi
Toadsworth – Toad – 1 Up

Lego 71014 The Mannschaft – Minifigures Collectibles Lego – May 2016

Lego 71014 The Mannschaft – Minifigures Collectibles Lego – May 2016

Lego 71012 Disney Minifigures Serie – Collectibles Series Lego April 2016

Lego size – Mattel – Minecraft collectible series 5 Ice
Chicken zombie – G code
Siamese cat – J code
Teleporting endy – H code
Wolf with bone – K code
Iron golem – D code
Alex with boat – F code
Killer rabbit – E code
Spawning Z pigman – A code
Steve mismatched armour – C code
Attacking Ghast – B code
Skeleton in flames – L code
Donkey – I code

I lost my cap… Mr. Minifigforlife didn’t ship it to me…
I am very sad!!

Lego Mixels Series 7 – 41554-41562
March 2016

Lego Duplo compatibile – Unico Plus – Ape Maia (Bee Maya) with his friend Willy and Flip, the grasshopper
Minifigures from set 8587 – Unico Plus 2012

Lego 71011 Minifigures Serie 15 – Collectibles Series Lego February 2016

Lego 71011 Minifigures Serie 15 – Collectibles Series Lego February 2016

Lego Magazine Nexo Knights
Panini comics February 2016

Lego 21106 Minecraft Nether

Lego 21105 Minecraft Village

Lego 21102 Minecraft Forest

Lego 5943 Bellville Interior designer
Lego 2004

Lego 5942 Bellville Pop studio
Lego 2004

Lego Duplo birthday cake – Torta di Compleanno

Lego 40139 Gingerbread House – Casetta Pan di zenzero Marzapane
2015 Limited Edition

Lego Christmas Holy Crib – Presepe di Natale

Lego Christmas Sailing … Ball
Buy a trasparent plastic ball and some coloured ribbons.
You need, for the Hull:
– 1 Brick 1 x 1
– 2 Inverted Slope
– 1 Plate 1 × 4
You need for the Sail:
– 1 Brick 1 x 1
– 2 Slope
– 1 Tile Slope
And 1 Brick round 1 × 1 for the Mast

Lego Christmas Sailing … Ball
Use the Glue in order to fix the Sailing Boat to bottom of the Ball
Before closing the ball, put inside few transparent Lego small pieces.
It looks nice, isn’t It?

Lego Christmas decorative balls
Do it by yourself: buy some transparent balls from stationer (two peaces each) and buy colored ribbons from haberdashery. Fill then the balls with colorful Lego pieces.
That’s all!
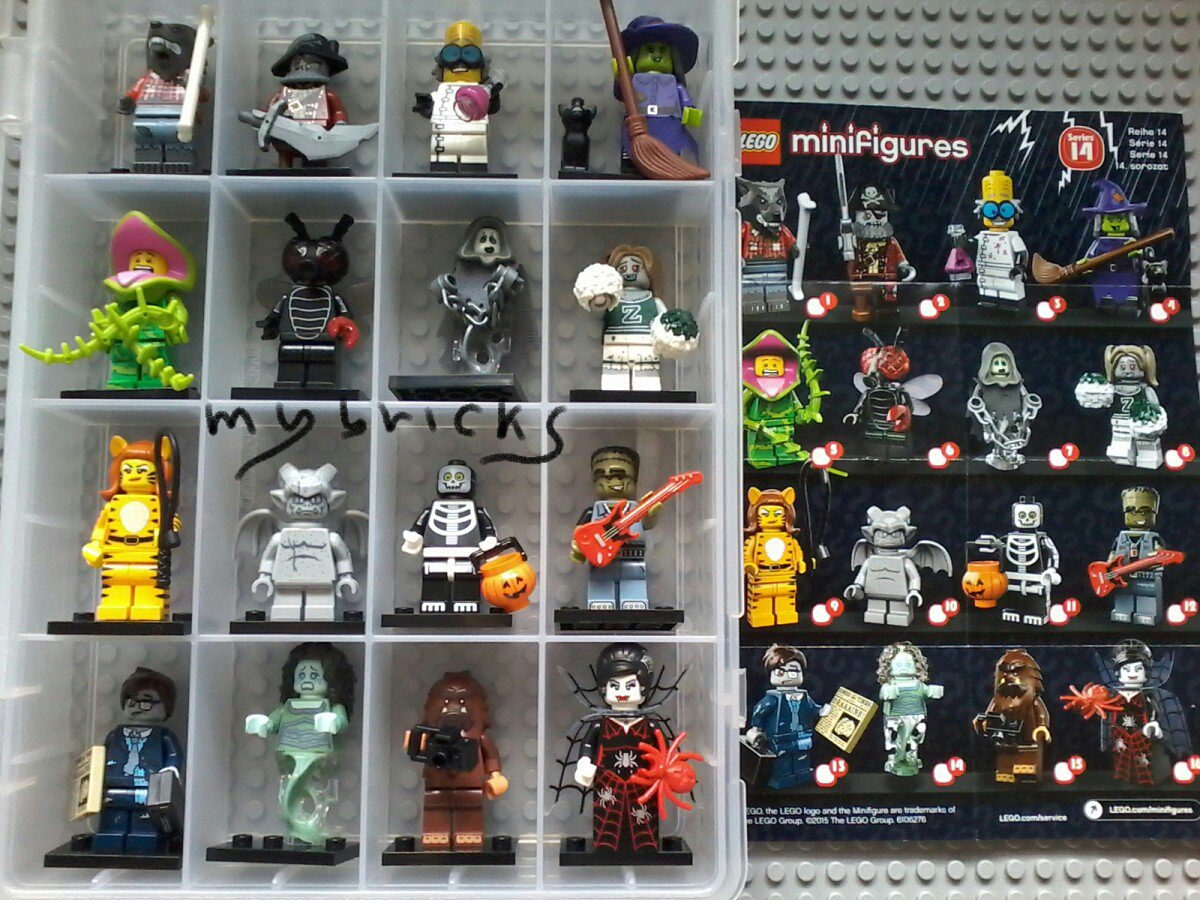
Lego 71010 Minifigures Serie 14 – Collectibles Series September 2015

Lego size – Mattel – Minecraft collectible series 4 Obsidian
Spawning spider – F code
Tabby Cat – B code
Slime Cubes – A code
Sneaking Creeper – D code
Zombie at door – E code
Screaming Enderman – C code
Rabbit – G code
Skeleton With Pumpkin Helmet – H code
Steve? With Arrow Damage – I code
Sheared Sheep – L code
Alex With Cake – K code
Priest Villager – J code

Lego Mixels Series 6 – 41545-41553
October 2015
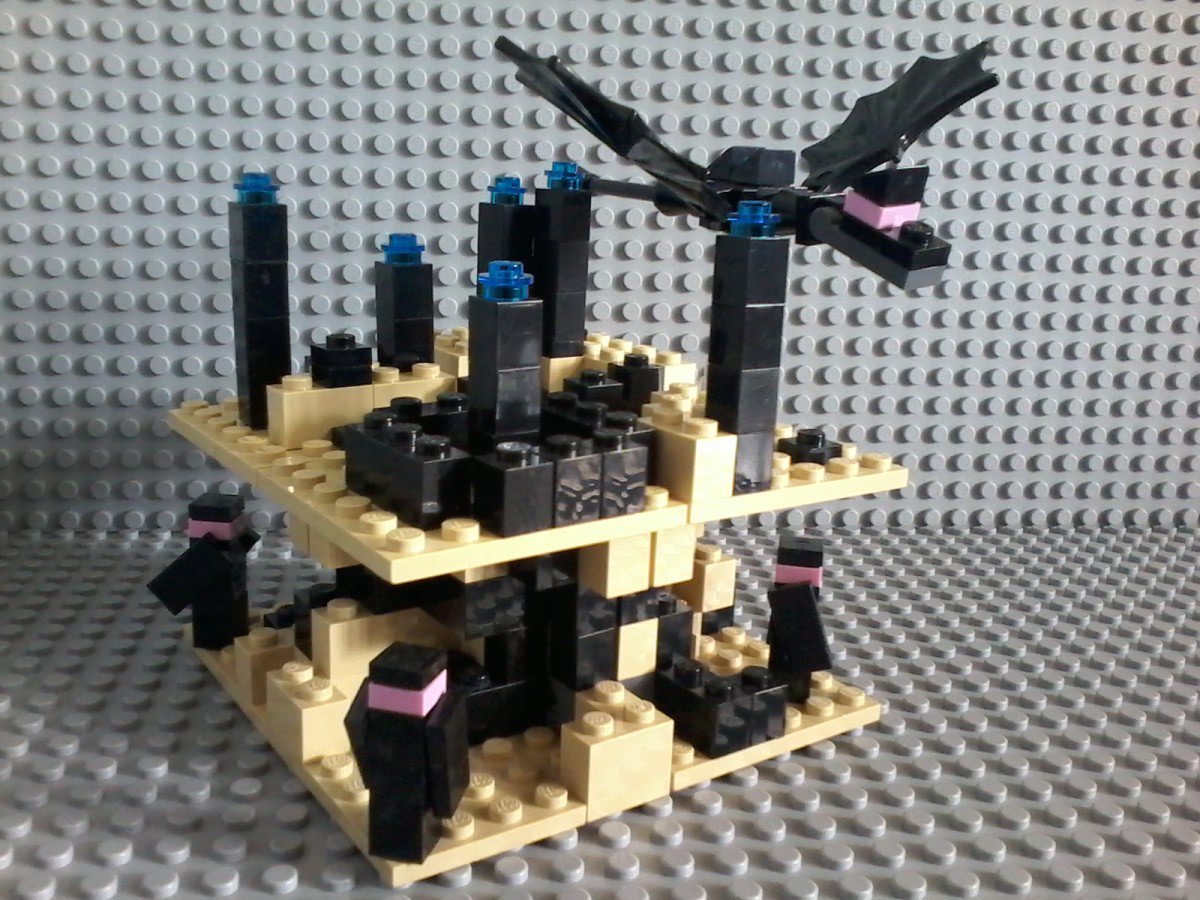
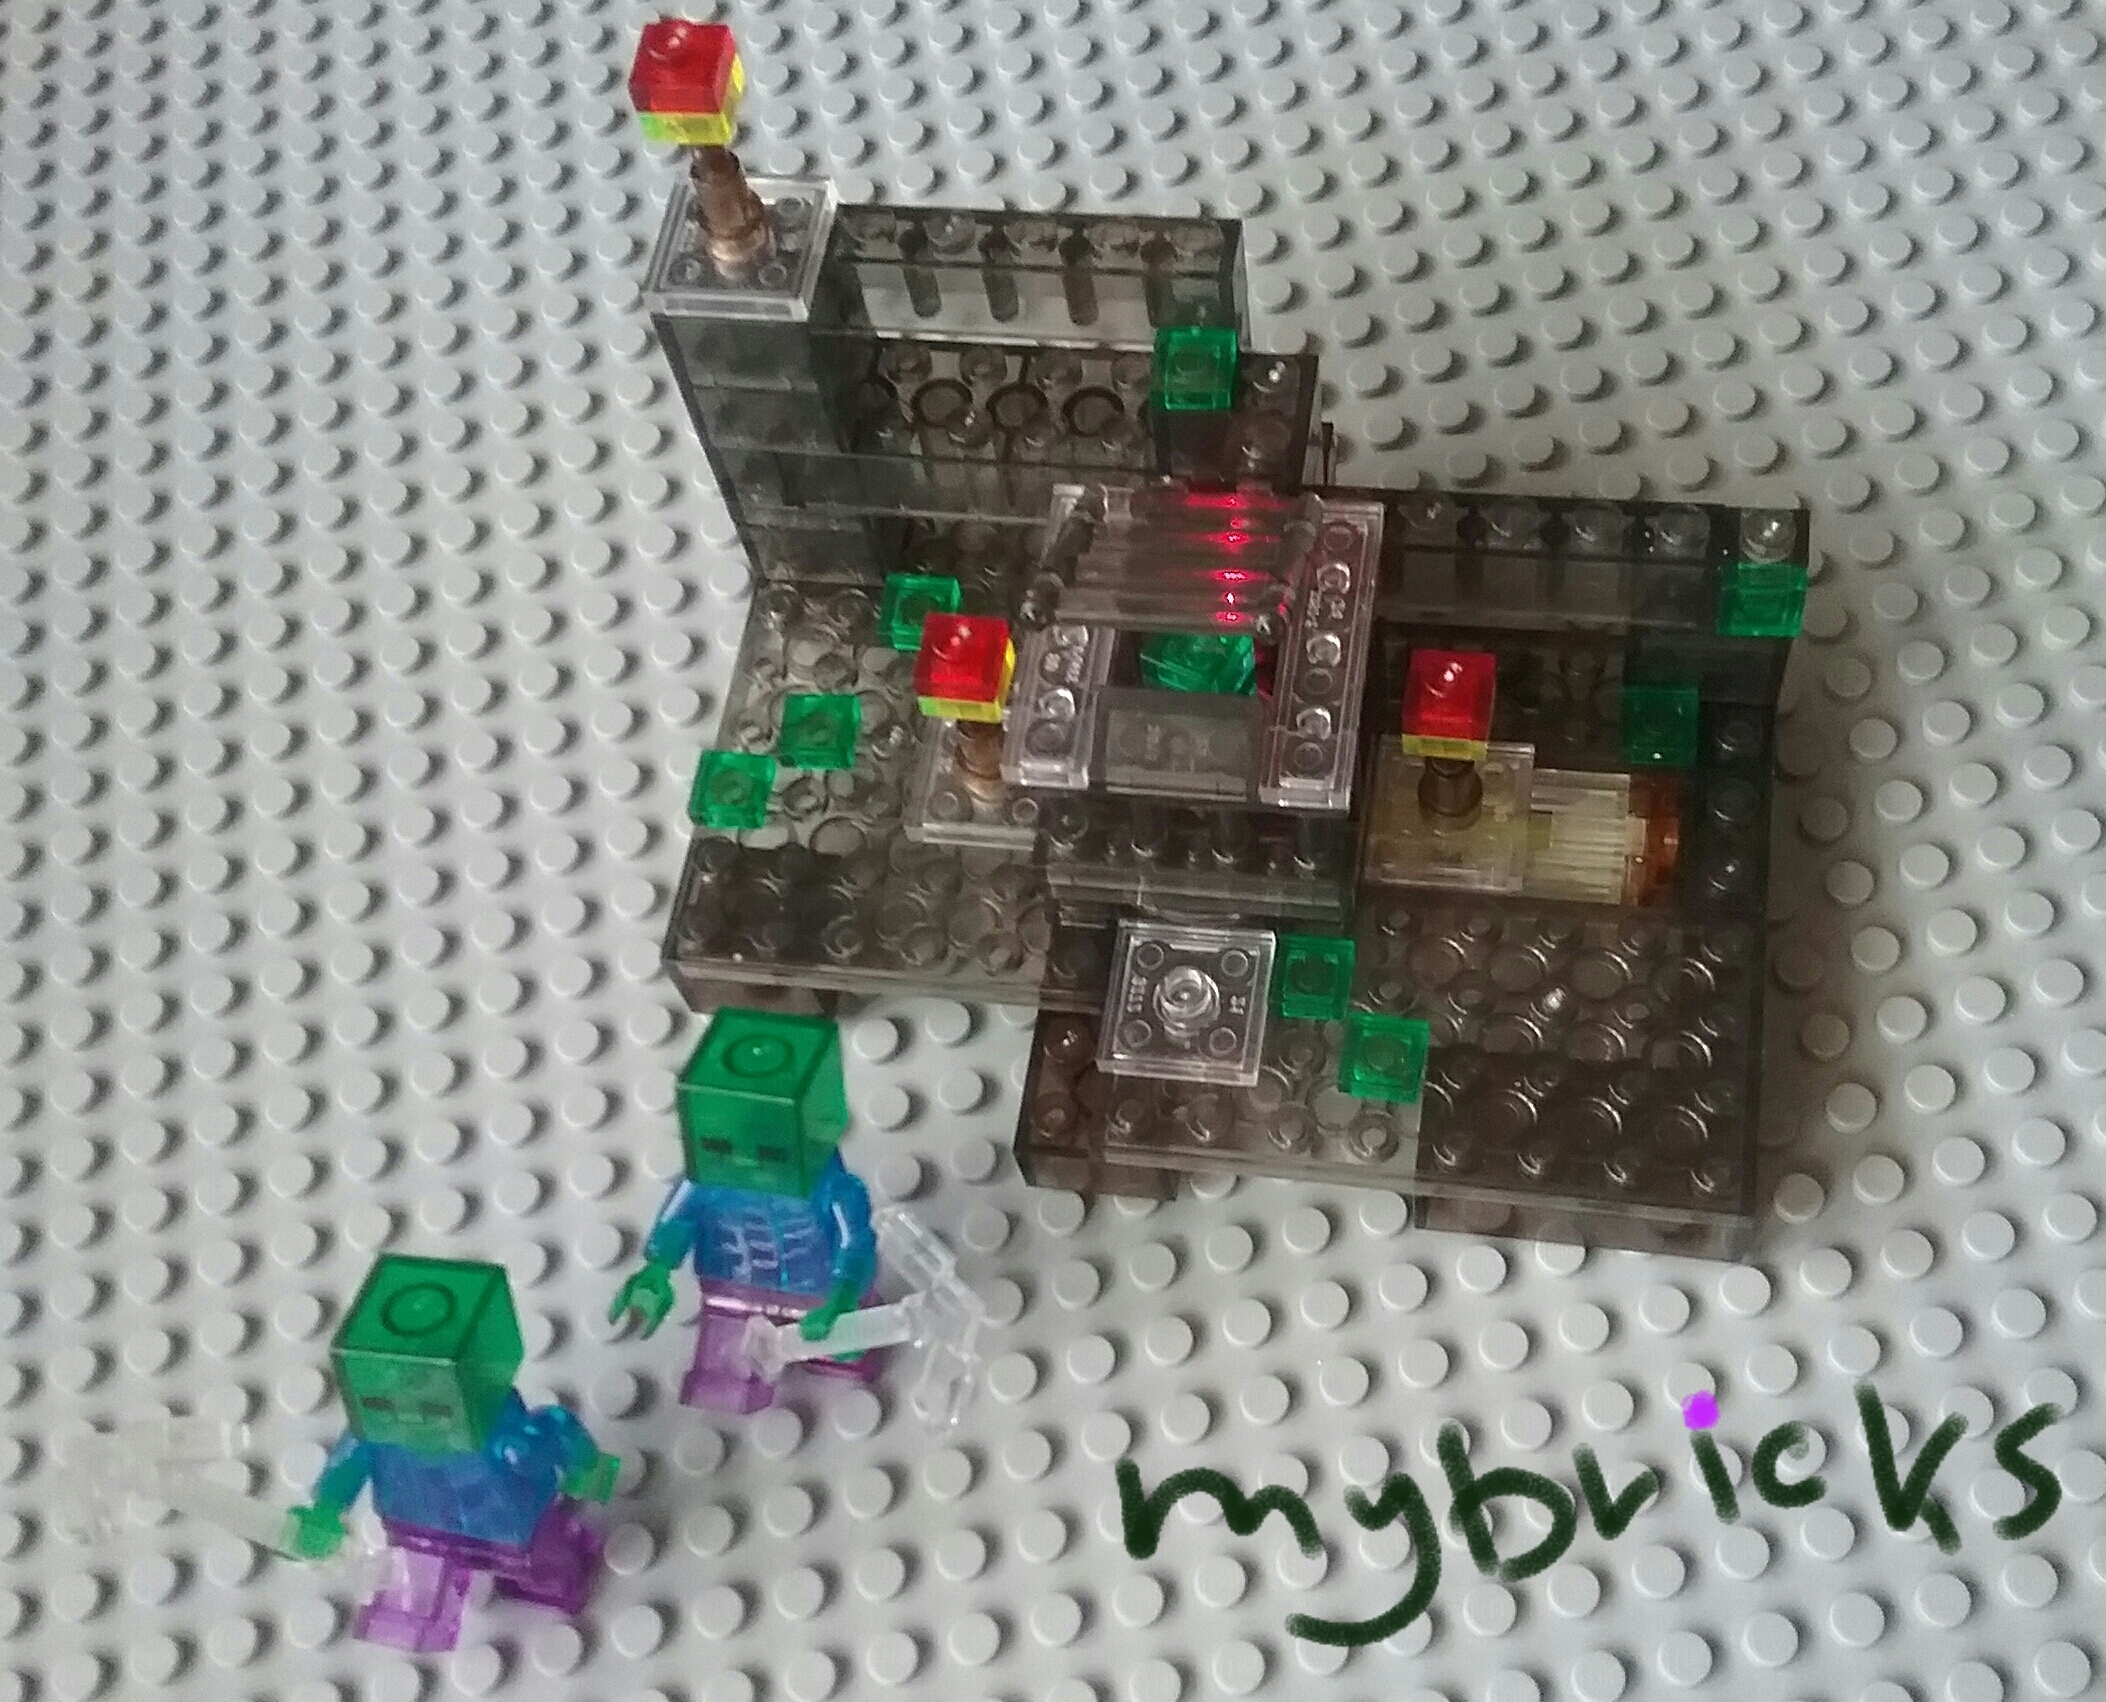
Lego Minecraft the End
Lego MOC inspired by Lego 21107

Lego Minecraft the End
Lego MOC inspired by Lego 21107

Lego size – Mattel – Minecraft collectible series 3
Steve? Diamond armour – A code
Squid – B code
Ghast – C code
Mooshroom – D code
Wither skeleton – E code
Zombie in flames – F code
Blaze – G code
Alex – H code
Zombie iron armour – I code
Steve? On minecart – J code
Cave spider – K code
Skeleton horse – L code
Lego size – Mattel – Minecraft collectible series 2
Steve? Iron armour – O Code
Zombie – P Code
Bats – S Code
Ocelet – N Code
Steve? TNT – U Code
Electrified – Q Code
Undead horse – W Code
Sitting wolf – X Code
Saddled pig – V Code
Chichen – M Code
Zombie pigman – R Code
Wither – T Code

Lego size – Mattel – Minecraft collectible series 1
Creeper – B code
Iron Golem – H code
Cow – G code
Cat – L code
Steve? – A code
Steve? Gold armour – E code
Dyed sheep – I code
Skeleton – C code
Snow golem – F code
Horse – K code
Enderman – D code
Zombie villager – J code

Lego Minecraft Happy Birthday
On The right: Steve? Iron Armour (Mattel Minifigure – Series 2)

Lego Minecraft MOC
Zombie Chichen Creeper
To create them you need few plates 1×1 green, white and black

Lego Compatible – JLB – Masha and the Bear
Very nice minifigures
even if quality of plastic and painting colours are not the best.
June 2015

Lego compatible – Mega Bloks –
10757 Puffi Smurfs Shlumpfs – Collectibles series
May 2015
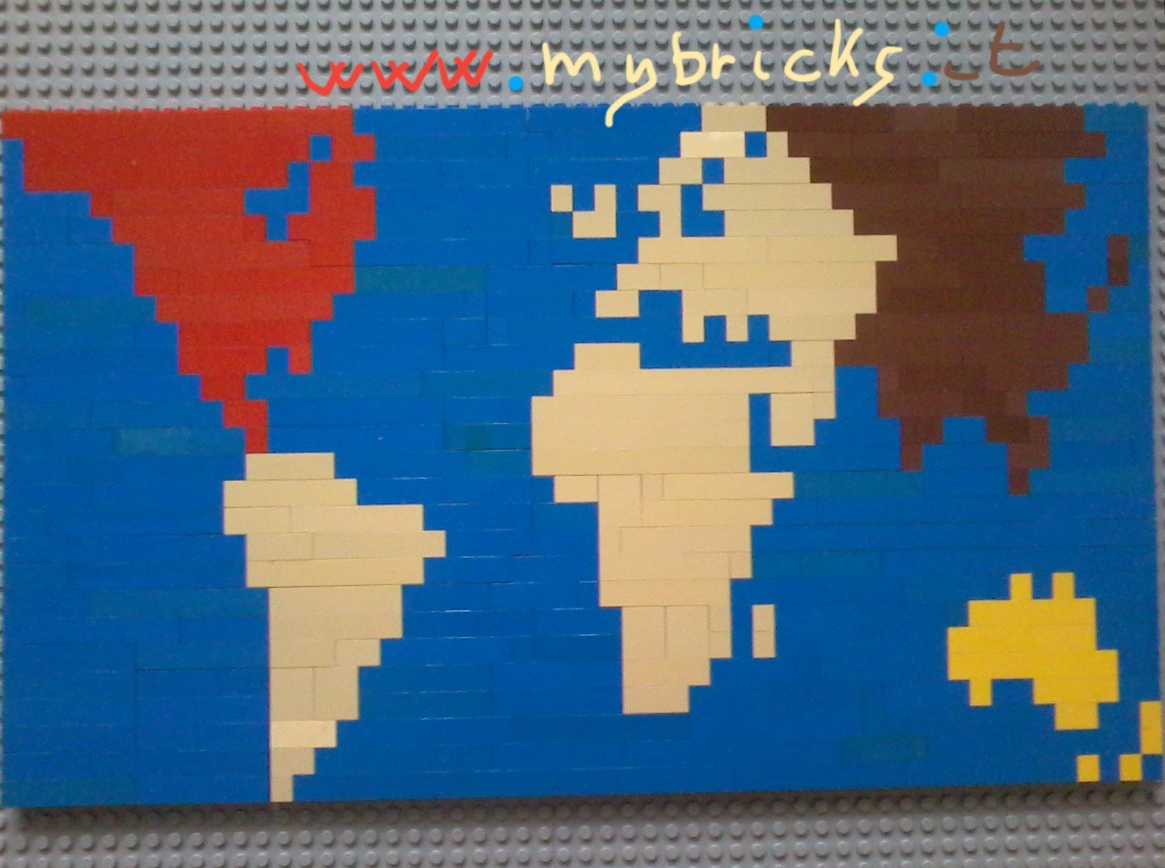
Lego World
In My fantasy, Our World looks like Pinocchio!
If You rotate 90 degrees on The left You Can imagine Pinocchio profile:
– North America is The Red dress
– South America is The Wooden Hand
– Africa and Europe are The Wooden Face (with Pinocchio looooong nose!)
– Russia and Asia is the Hair

Lego Torredarecord Event Gadget
Milano 17-21 Giugno 2015

Lego Torre Record – Milano 21 June 2015
La Fabbrica del Vapore – Via Procaccini 4
35 METERS OF LEGO! F A N T A S T I C !

Lego #Torredarecord

Lego Technic 8865 Test Car
Lego 1990

Lego Technic 8865 Test Car
Complete in original box
(Item can be motorized with Lego Technic 8720)

Lego Technic 8851- Excavator Bauanleitung
Lego 1984

Lego Mixels Series 5 – 41536-41544
June 2015

Lego Celebration Cake

Lego Celebration Storage box Favours

Lego Minitalia 12
Lego 1978

Lego Clikits

Lego Clikits sets

Lego compatible – Sheng Yuan – Fantastic Four Collectible Series
Mr.Fantastic
Human Torch – Torcia Umana
Invisibile Women – La donna Invisibile
The Thing – La Cosa
Doctor Doom
Silver Surfer
Pyro
Flaming Red Human Torch

Lego compatible – Decool – Rhino Venom Iron Men Green Goblin Hulk
Rhino – Venom – Iron Men – Green Goblin
Hulk
Good quality product, even if head is not mobile; arms and hands are playable.

Lego 71009 Minifigures Serie Simpson – Collectibles Series April 2015

Plastic City 92 – Historic Series Italocremona
Year 1983

Lego Relaxing Bath
Take time and relax yourself!
Dedicate 30 minutes to yourself.
Arrange some candles for a soft light; a warm bath improve your health and feel better about yourself!

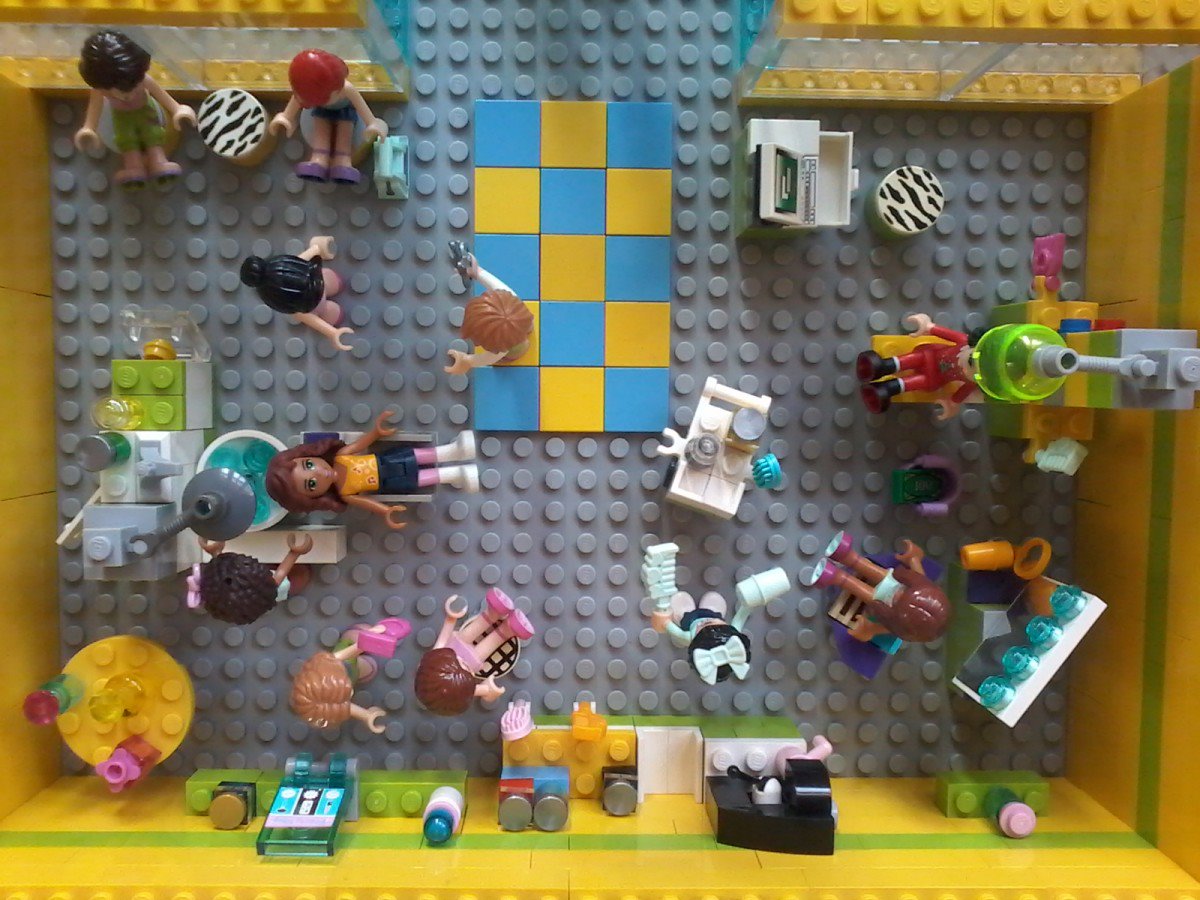
Lego Friends Name – Minifigures Names

Lego Friends Beauty Shop Salon


Lego Easter Eggs inspired by Lego set 40121
HAPPY EASTER! – BUONA PASQUA!

Oops!
Two eggs are broken!
Patty is angry anytime! His brother – George – is really a bundler!!
Oops! Due uova rotte! – Patty e’ sempre arrabbiata e suo fratello George e’ proprio un pasticcione!

Lego Pharaoh’s Sarcophagus


Lego Simpson KIWK E MART market – Set 71016 MOC preview


Lego Mixels Series 4
February 2015

Lego Mixels Series 4
ROKIT

Lego Mixels Series 3
September 2014

Lego Mixels Series 3
MAGNIFO (violet)
TORTS GLURT (green)

Lego Mixels Series 2
June 2014

Lego Mixels Series 2
BALK (orange)
LUNK SLUMBO FLURR (blue)

Lego Marvel Super Heroes
BATMAN SUPERMAN IRONMAN THOR MR.AMERICA
CATWOMAN BATMAN SPIDERMAN HULK VOLVERINE

Lego Egypt Sphinx
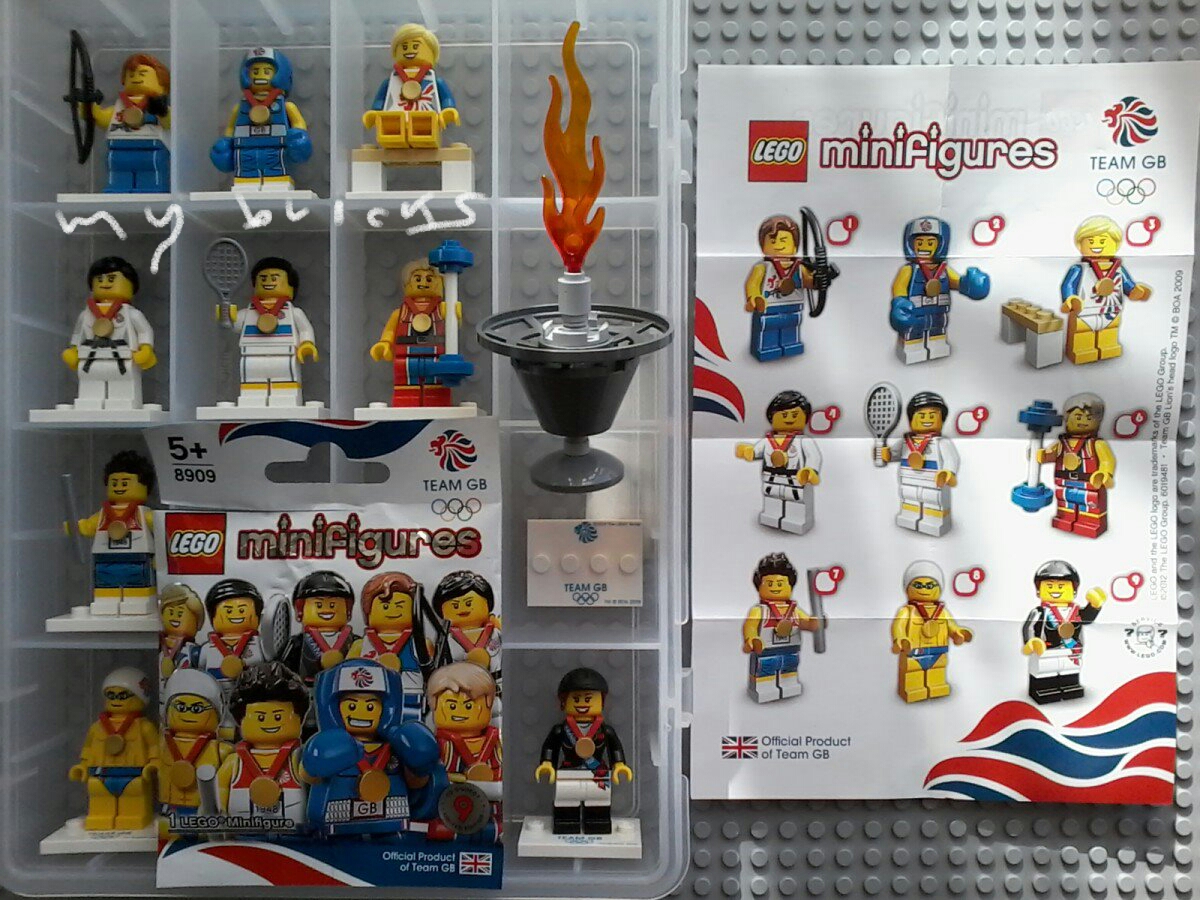
Lego 8909 Minifigures Serie Team GB London Olympic Collectibles Series Lego July 2012

Lego 041 Duplo
Lego – Year 1979


Lego Women’s day 8 March – Wishes to all Womens in the world!
Festa della donna – AUGURI A TUTTE LE DONNE DEL MONDO!
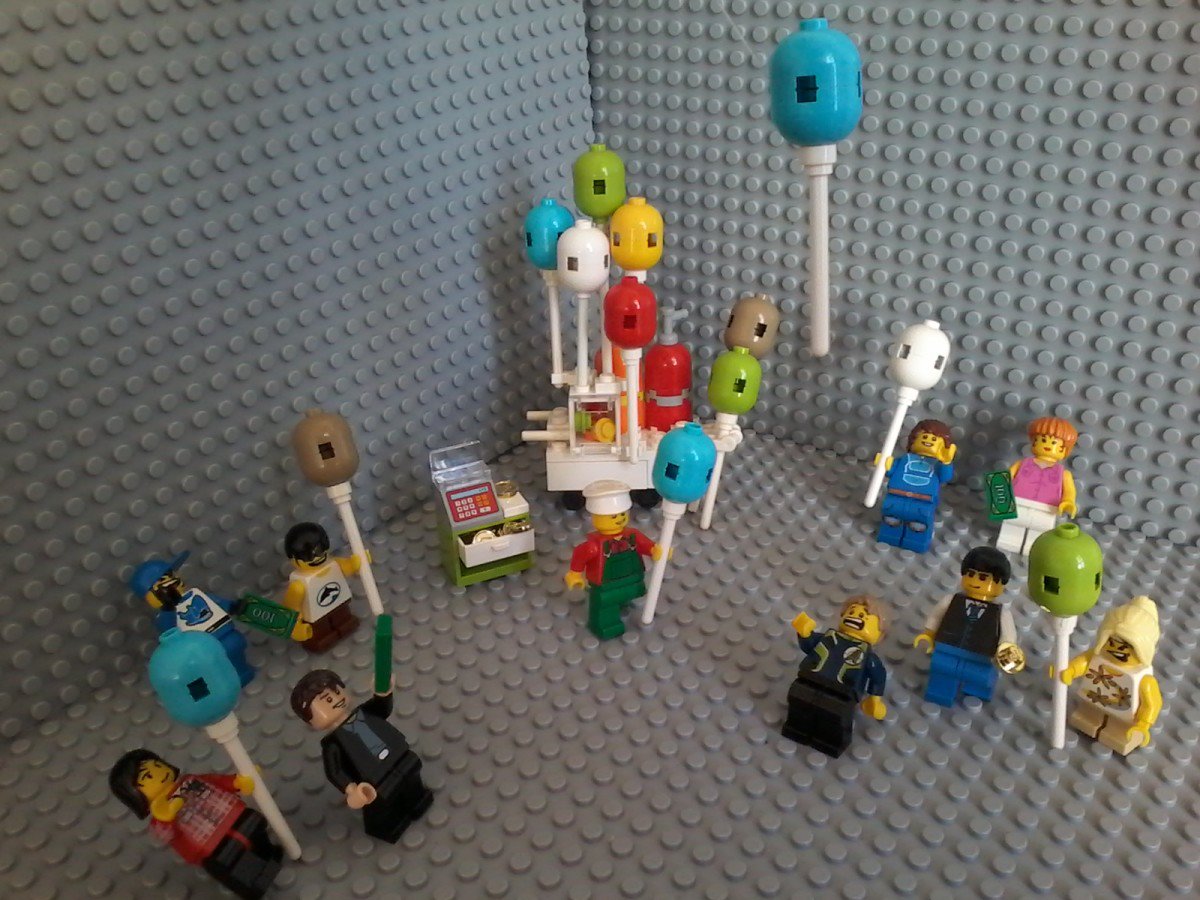
Lego 40108 Baloon Shop
Oh no!!
George lost his baloon! His sister is very angry…
Baloon salesman is bringing him another!

Lego 41071 Elves Aira workshop
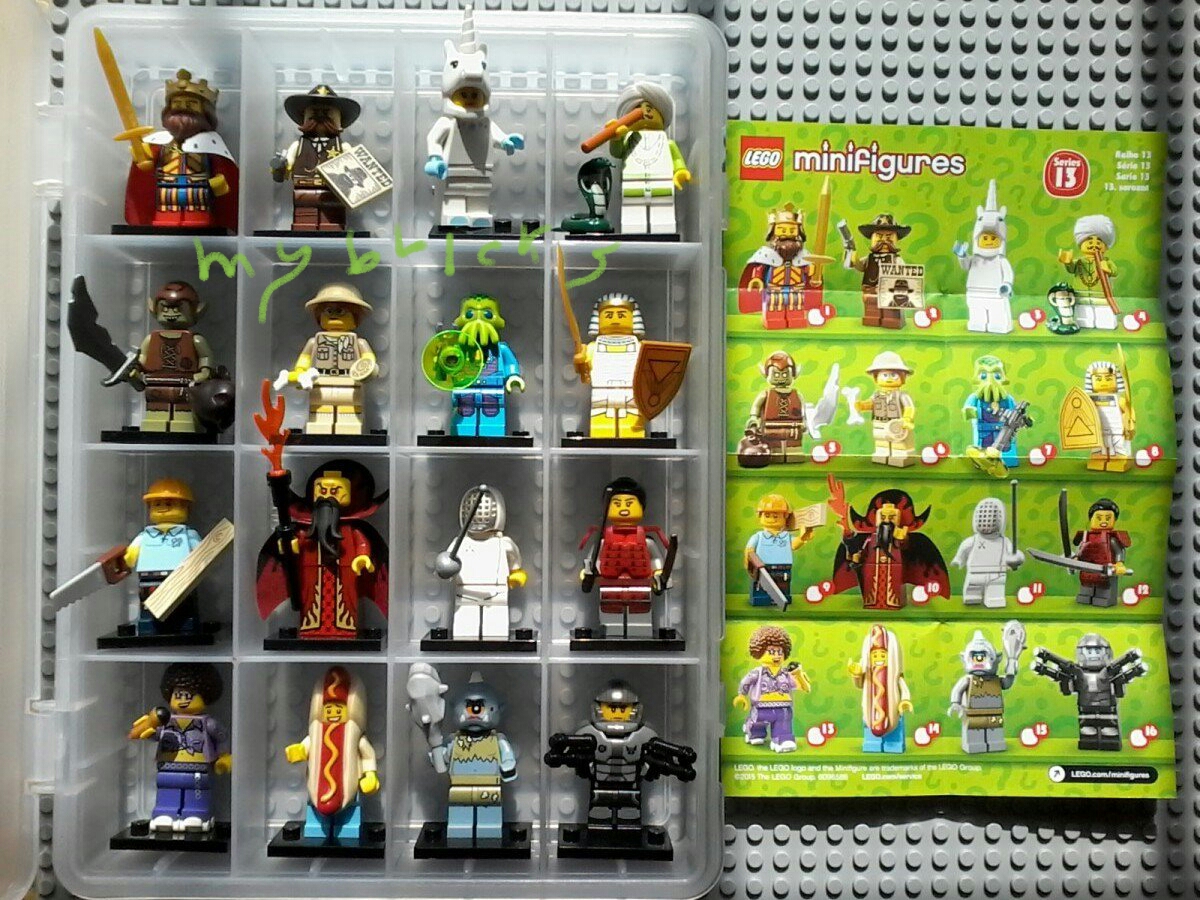
Lego 71008 Minifigures Serie 13 – Collectibles Series February 2015

Lego Magazine Ninjago – Feb. 2015
Ninja Kai Included!

Lego 70505 Ninjago The final battle – 2013
Golden ninja included!

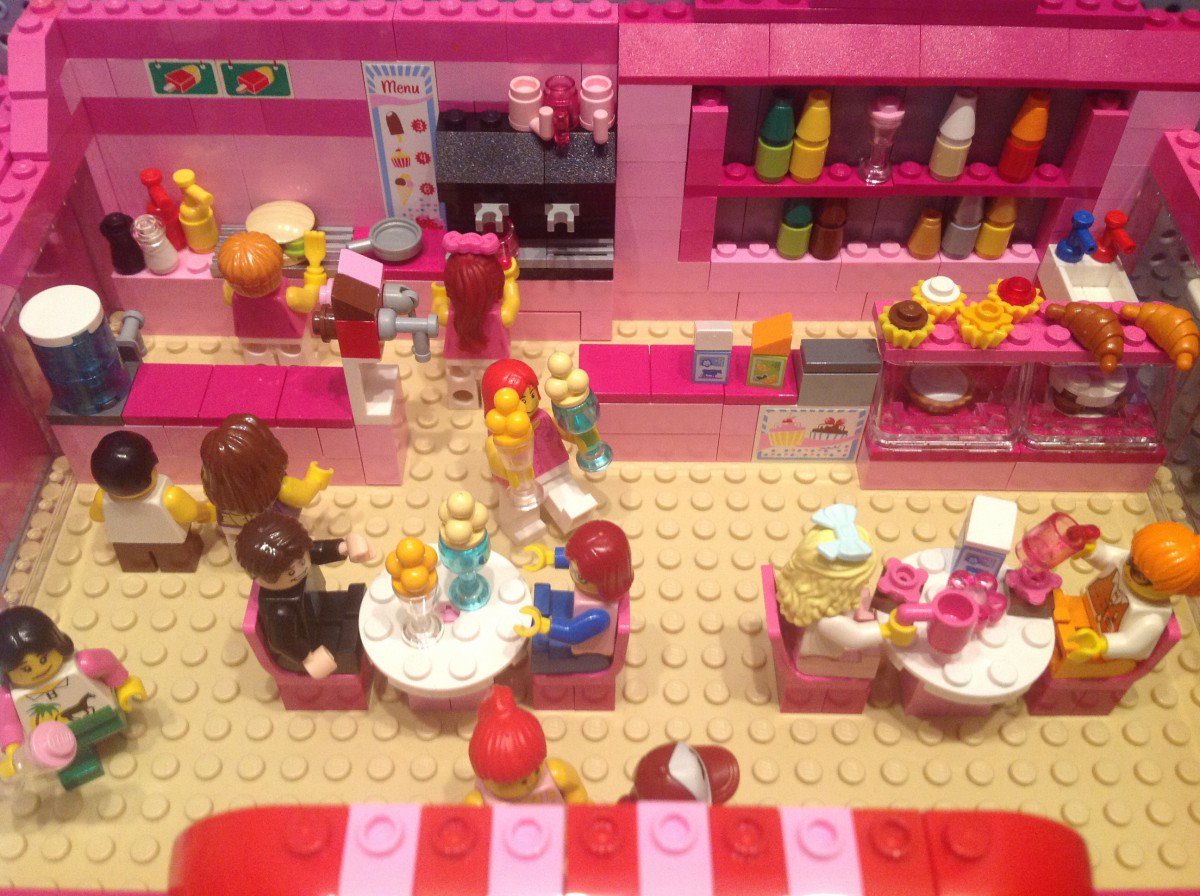
Lego 41035 Juice Bar
Lego Juice Bar inspired by Lego set 41035


Lego 3061 cafe
Lego Cafe inspired by Lego set 3061


Lego Cafe – Toilette

Lego Piano Pianoforte Concert


Lego 41087 Rabbit Puppies

Lego Snake Pharaoh’s Quest inspired by Lego set 7325

Lego Beatles

Lego Snoopy & Woodstock
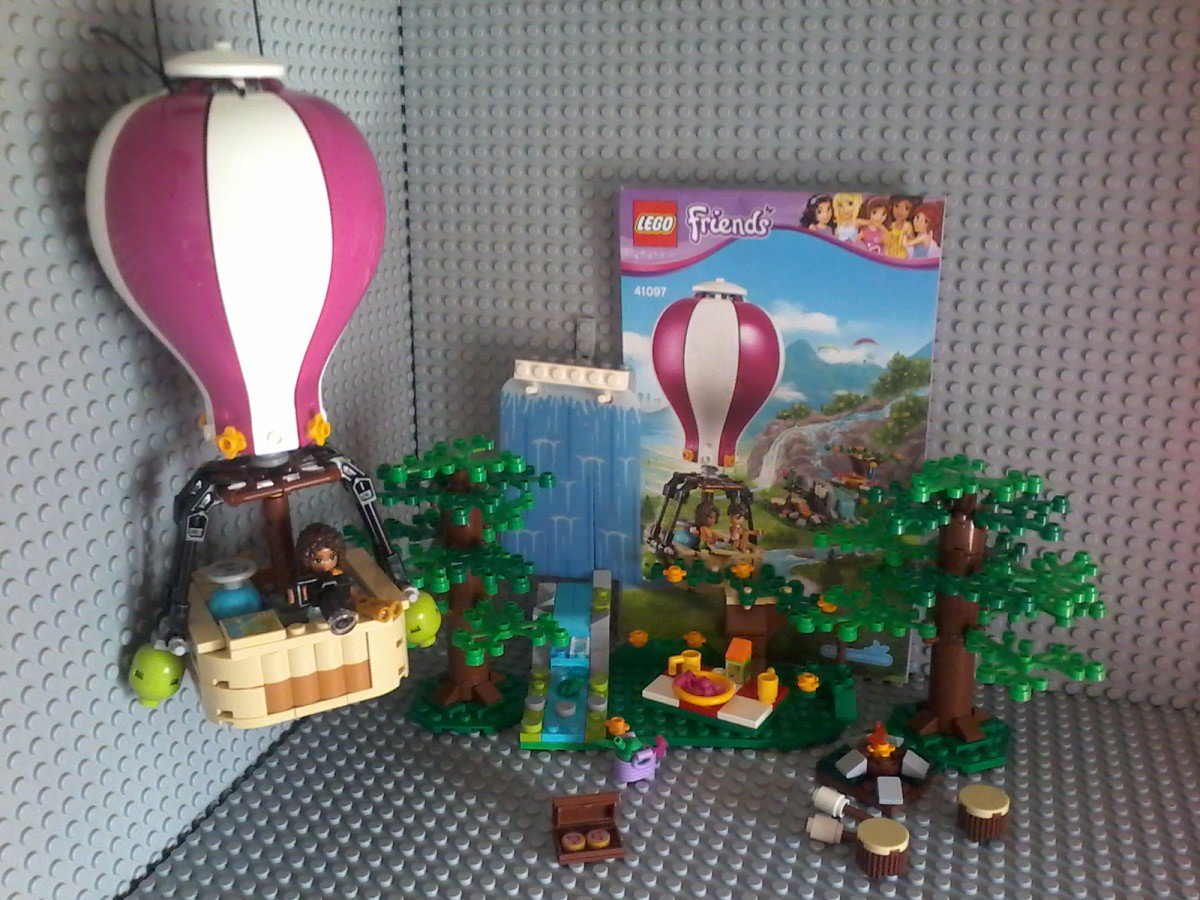
Lego 41097 Mongolfiera Air Baloon

Lego 5956 Air Baloon Expedition Zeppelin Dirigibile
Lego 1999

Lego car – Clikits festival – Lego cars decorated with Lego clickits pieces. Lovely!

Lego baby pram – Lovely babies: microfigs and trophy-figs!

Lego living room sala tv – Watching TV sitting on lovely armchairs decorated with Lego clickits pieces.

Lego swimming pool piscina – cuore heart – A trasparent base Plate with macaroni red bricks: that’s a nice heart!

Bricks Shokkybandz – Nice bricks, but very poor quality…
The connector bars are soft and they easily make broken.

Lego 7557 7558 7559 Clikits – Small pieces trasparent, glittered, funny shape in order to construct bracelets, rings, necklaces…
Nice to ornate Lego bricks studs.

Lego Fabuland Memory Cards
Lego 1984

Lego VIP Card

Lego compatible – Ionix clever bricks. Very quality bricks.
One brick transforms itself in a Perfect tropper!
Amusing!

Lego Fencing Minifigs – Scherma – Lego Fencing Match. Left side doesn’t touch. Right side touches. Right point.
Lego Fencing Minifigs – Scherma – LEGO Fencing Match.
Left side doesn’t touch.
Right side touches.
Right point.

Superbrix Scorpione Scorpio
So small pieces.made with really very good quality!
Lego Pokemon
Pikachu Plusle Togepi Trynitar
Bulbasaur Oshawott

Lego 850807 Mr. Gold

Lego 1778 1779 1823 Gashapon surprises
Lego 1997

Lego Gatto Topo Cat Mouse inspired by Lego Mixels

Lego 5608 Duplo Train
Lego Duplo 2008

Duplo farm

Duplo indian’s reservation

Lego Halloween
Happy Halloween!
A little smaller than a Barbie, funny to dress, comb and play with Lego and Clikits accessories!

Ninja Turtles – Leonardo Raffaello Donatello Michelangelo
Leonardo (blue)
Raffaello (red)
Donatello (purple)
Michelangelo (orange)
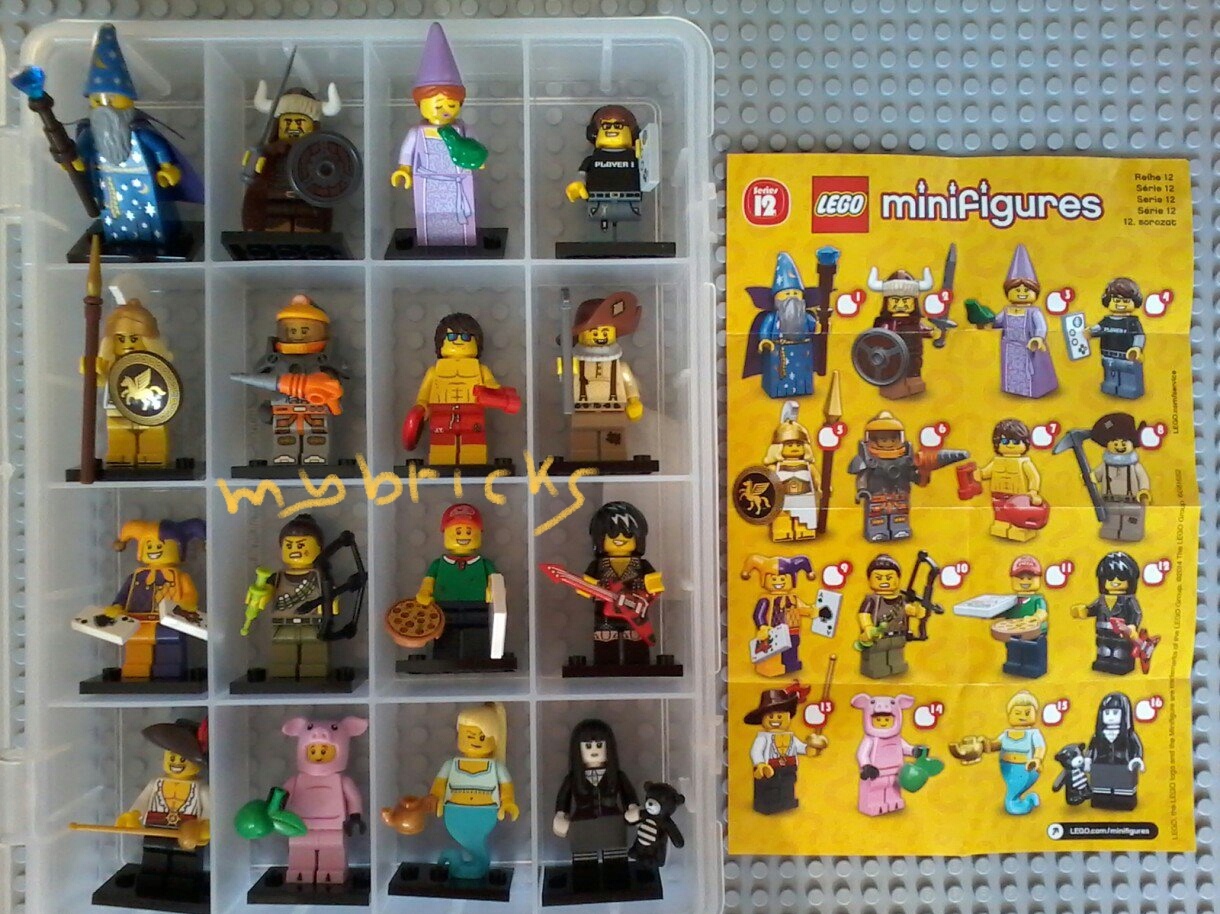
Lego 71007 Minifigures Serie 12 – Collectibles Series Lego Oct . 2014

Lego Storage Head Box
Measures Big Head:
– Diameter 23cm
– Height 27cm
Measures Small Head:
– Diameter 15 cm
– Height 18 cm

It is possible to storage inside a lot of pieces.
On the base, there is an embossed stud in order to pile heads on head’s-lid

Lego Max Promotional
To construct it, I have used some bricks, some technic bricks with hole, slopes and inverted slopes.

Lego 2945 Duplo Toolo
Very clever toy for children who like dad’s Lego Technics!
Very easy to combine bricks togheter using special tools included!

Lego Compatible – Pennyland Penny Market Gadget Toys October 2014
Lego Compatible – Pennyland
Penny Market Gadget Toys
October 2014
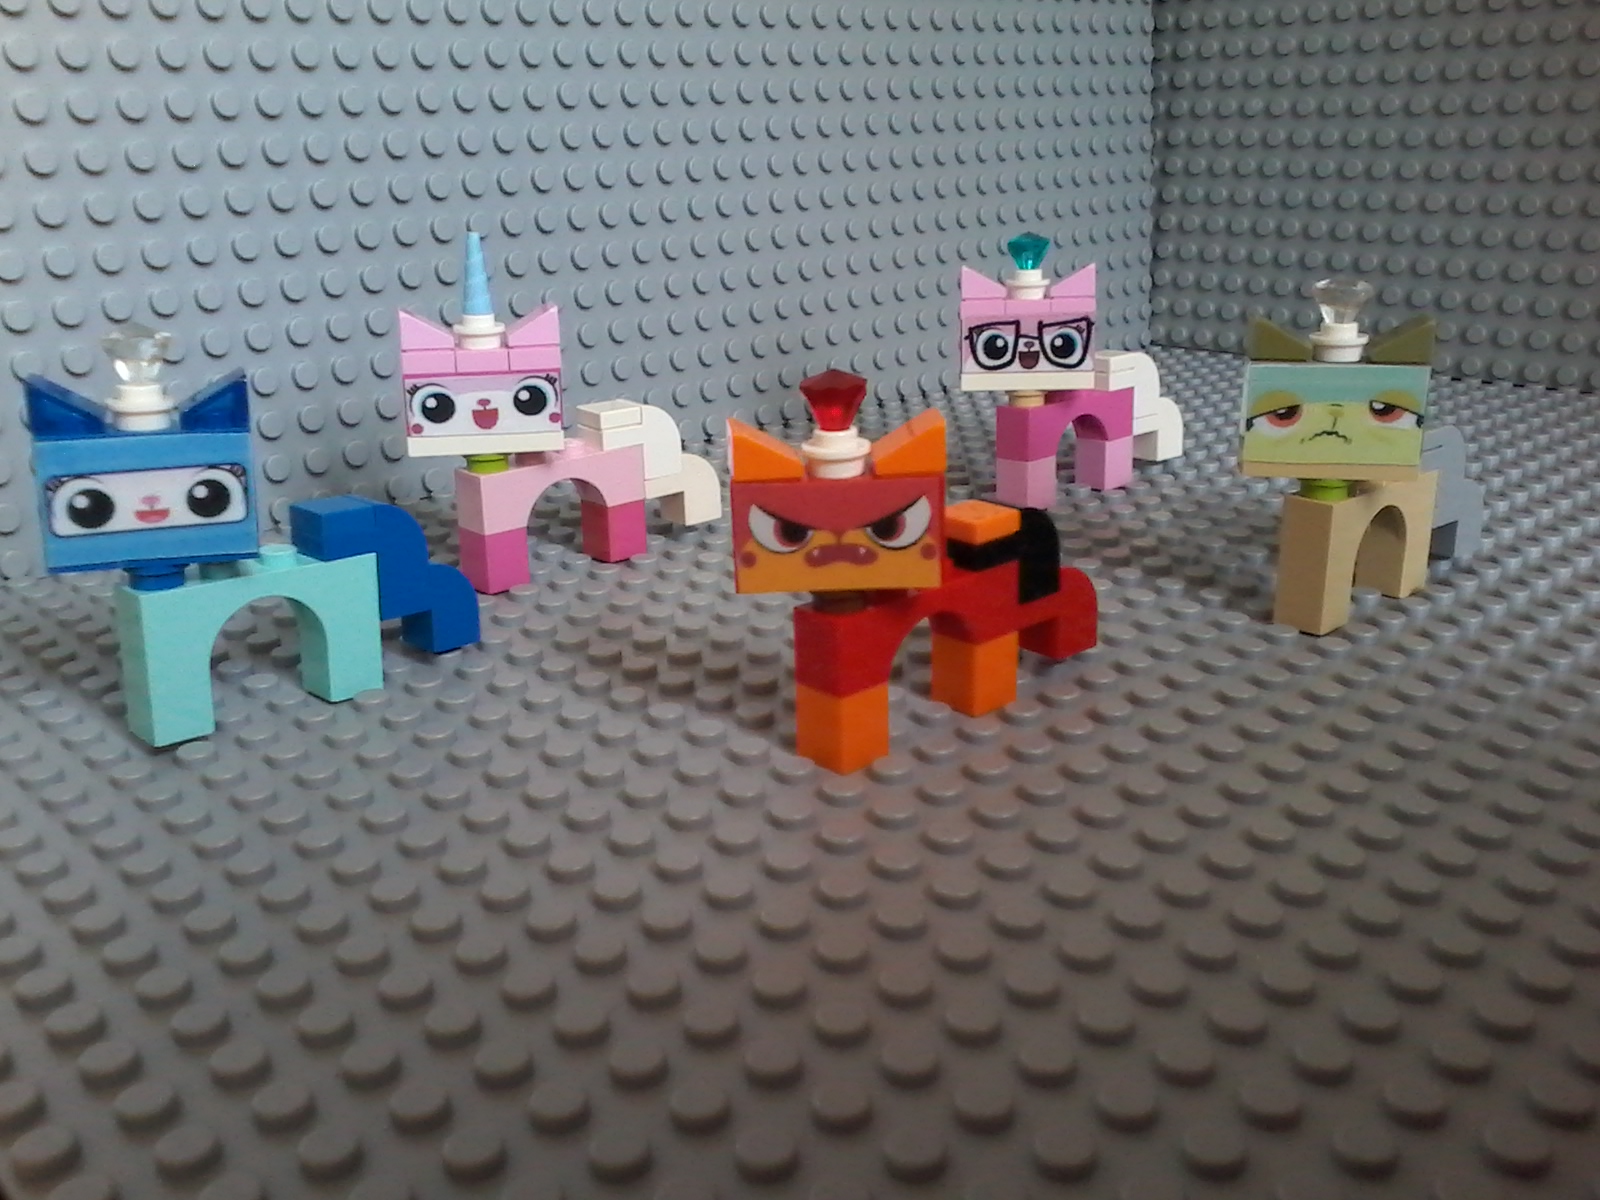
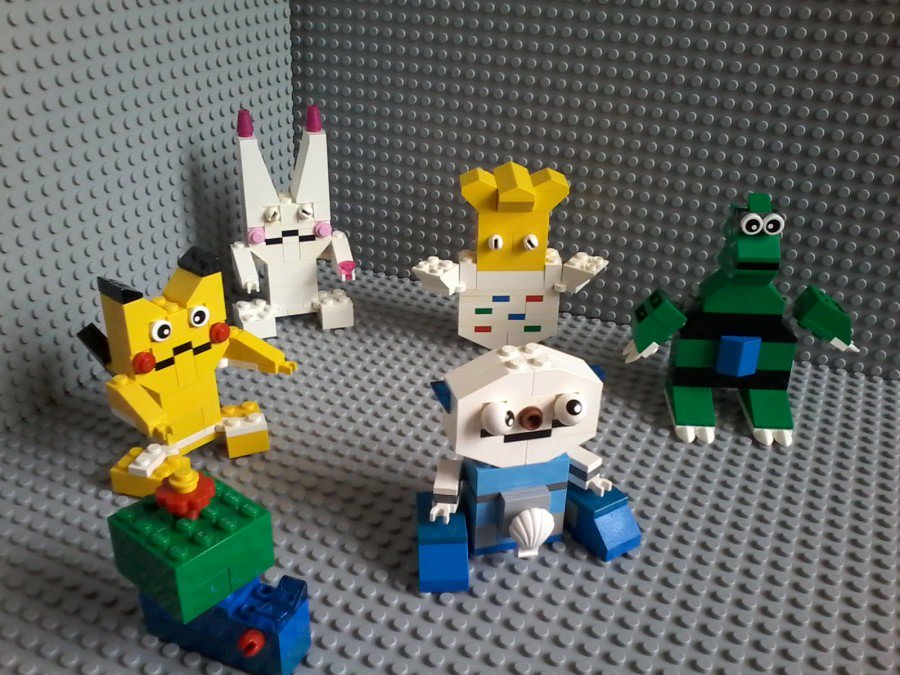
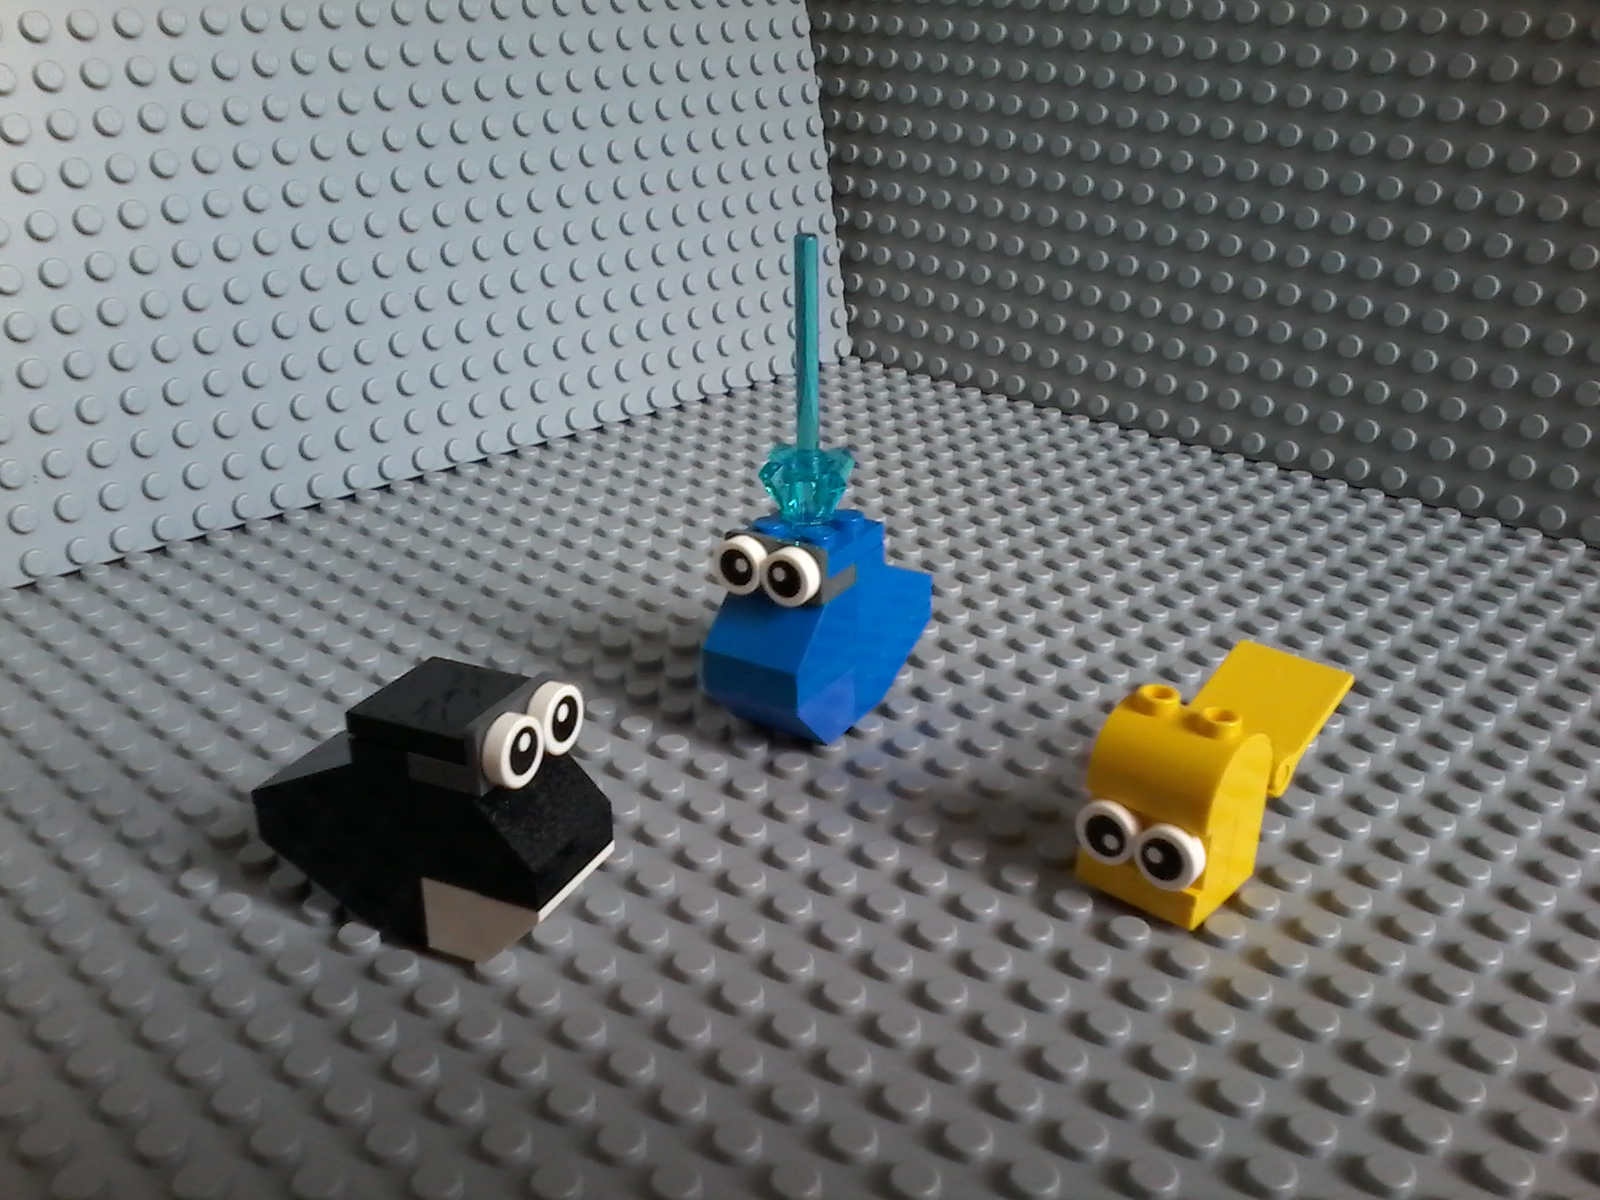
Lego Unikitty BIZNIS QUEASY ASTRO ANGRY KITTY
Few bricks, one arch, some stickers and slopes in order to construct my custom figures for Unikitty! Nice! Try! !

Lego tiny figures made with Small bricks.
 Lego 41047 41048 41049 Friends serie 6 – Collectibles series
Lego Cane Dog

Lego Topo Mouse

Lego Pecora Sheep

Lego Giraffa Giraffe

Lego Gallina Pulcino Chicken Chick

Lego Ape Bee

Lego Coccinella Ladybug

Lego Ragno Spider

Lego Foca Tricheco Seal Morse

Lego Rana Frog

Lego Maiale Pig

Lego Corvo Rook

Lego Elefante Elephant

Lego Zebra

Lego Movie Snail – Unikitty and Snail.
Lego Pesce Fish

Lego Mucca Cow

Lego Toro Bull

Lego Movie Colla – Super Glue
Aiuuuuuto!
Heeeeeelp!

Funghetti Lego – Mushrooms – Due simpatici funghetti che ricordano un videogame – Nice Mushrooms like a videogame.

Lego 2091 Primo Duplo
Lego 1996

Lego 71005 Minifigures Serie Simpson – Collectibles Series Lego July 2014

Lego Pac Man!

Lego 71006 Simpson Personaggi Mini figures

Lego Simpson 71006 Casa House – Lato sinistro – left side

Lego Simpson 71006 Casa House – Top

Lego Simpson 71006 Casa House – Lato destro – right side

Lego 71006 Simpson Garage

Lego Mixels Pixels

Lego Mixels Series 1 – 41500 41502 41501 FLAIN ZORCH VULX INFERNITES
Lego May 2014

Lego Mixels Series 1

Lego Mixels Series 1 – 41503 41505 41504 KRADER SHUFF SEISMO
Lego May 2014
Lego Mixels Series 1
Lego Mixels Series 1 – 41506 41508 41507 TESLO VOLECTRO ZAPTOR
Lego May 2014
Lego Mixels Series 1

Lego 41044 41045 41046 Friends serie 5 – Collectibles series
Lego May 2014

Lego Compatible – Sheng Yuan – Collectibles Series

Lego 71004 Minifigures Serie Movie – Collectibles Series Lego February 2014

S. Valentino Lego – Valentine’s day – Scatoline Lego per S.Valentino
Non sapevo come incartare il regalo di S.Valentino e mi sono ingegnata con un’idea originale.
Ho costruito anche qualche cuoricino di guarnizione. 🙂

Lego 41041 41042 41043 Friends serie 4 – Collectibles series
Lego February 2014

Lego 70007 Legends of CHIMA – Eglor’s Twin Bike
Abbiamo cominciato a costruire quello che ci ha portato Babbo Natale sotto l’albero.
Per adesso è pronto il set Lego 70007 di Legends of CHIMA.
Il set ha una buona giocabilità e contiene due minifigures; il montaggio della moto però ha richiesto ogni tanto l’intervento di un adulto in quanto non è semplicissimo e la prospettiva delle istruzioni può ingannare chi non è pratico di pezzi technic.

Lego 70109 Legends of CHIMA – Whirling Vines
La collezione CHIMA cresce grazie a questo nuovo set ricevuto per il compleanno del piccolo costruttore.

Tortina Lego – Birthday cake
Non poteva mancare per i sei anni del piccolo costruttore una tortina di mattoncini Lego.Certo che spegnere le candeline è stata dura….
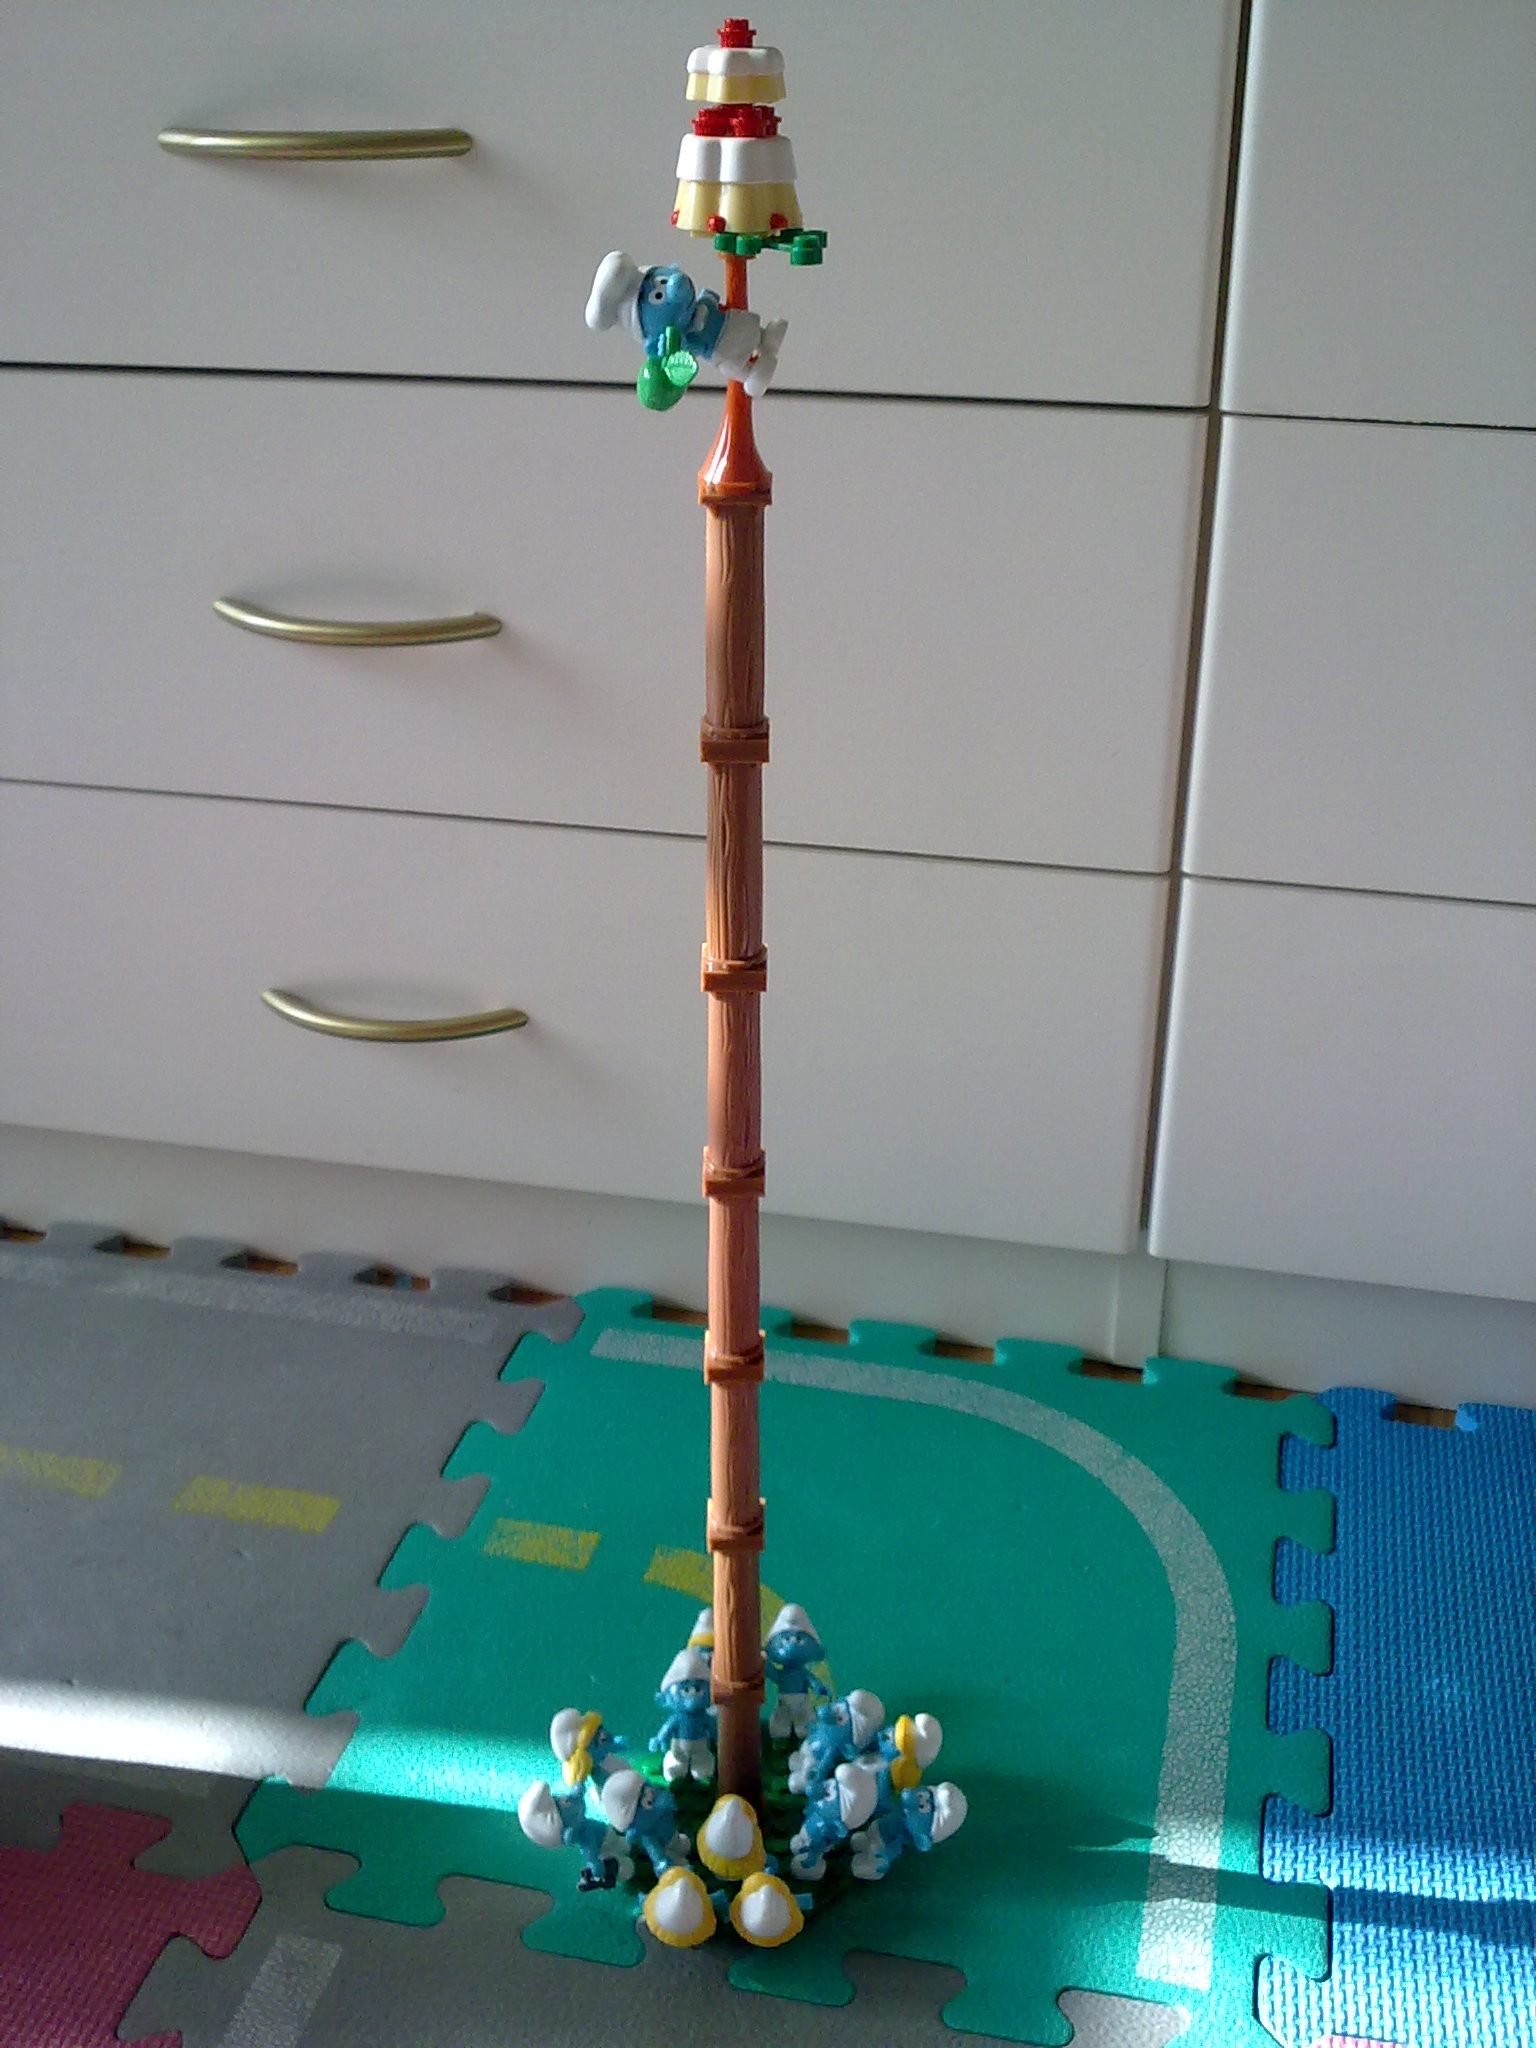
Mega Bloks – Puffi Albero della cuccagna – Smurf Greasy pole

Lego 41023 41024 41025 Friends serie 3 – Collectibles Series
Lego November 2013

Lego Cucchiaio per i Cereali – Breakfast Spoon

Lego Portatorta – Cake Box

Lego 71002 Minifigures Serie 11 – Collectibles Series Lego October 2013

Lego 41020 41021 41022 Friends serie 2 – Collectibles Series
Lego June 2013

Lego 71001 Minifigures Serie 10 – Collectibles Series Lego May 2013

Lego 41017 41018 41019 Friends serie 1 – Collectibles Series
Lego March 2013
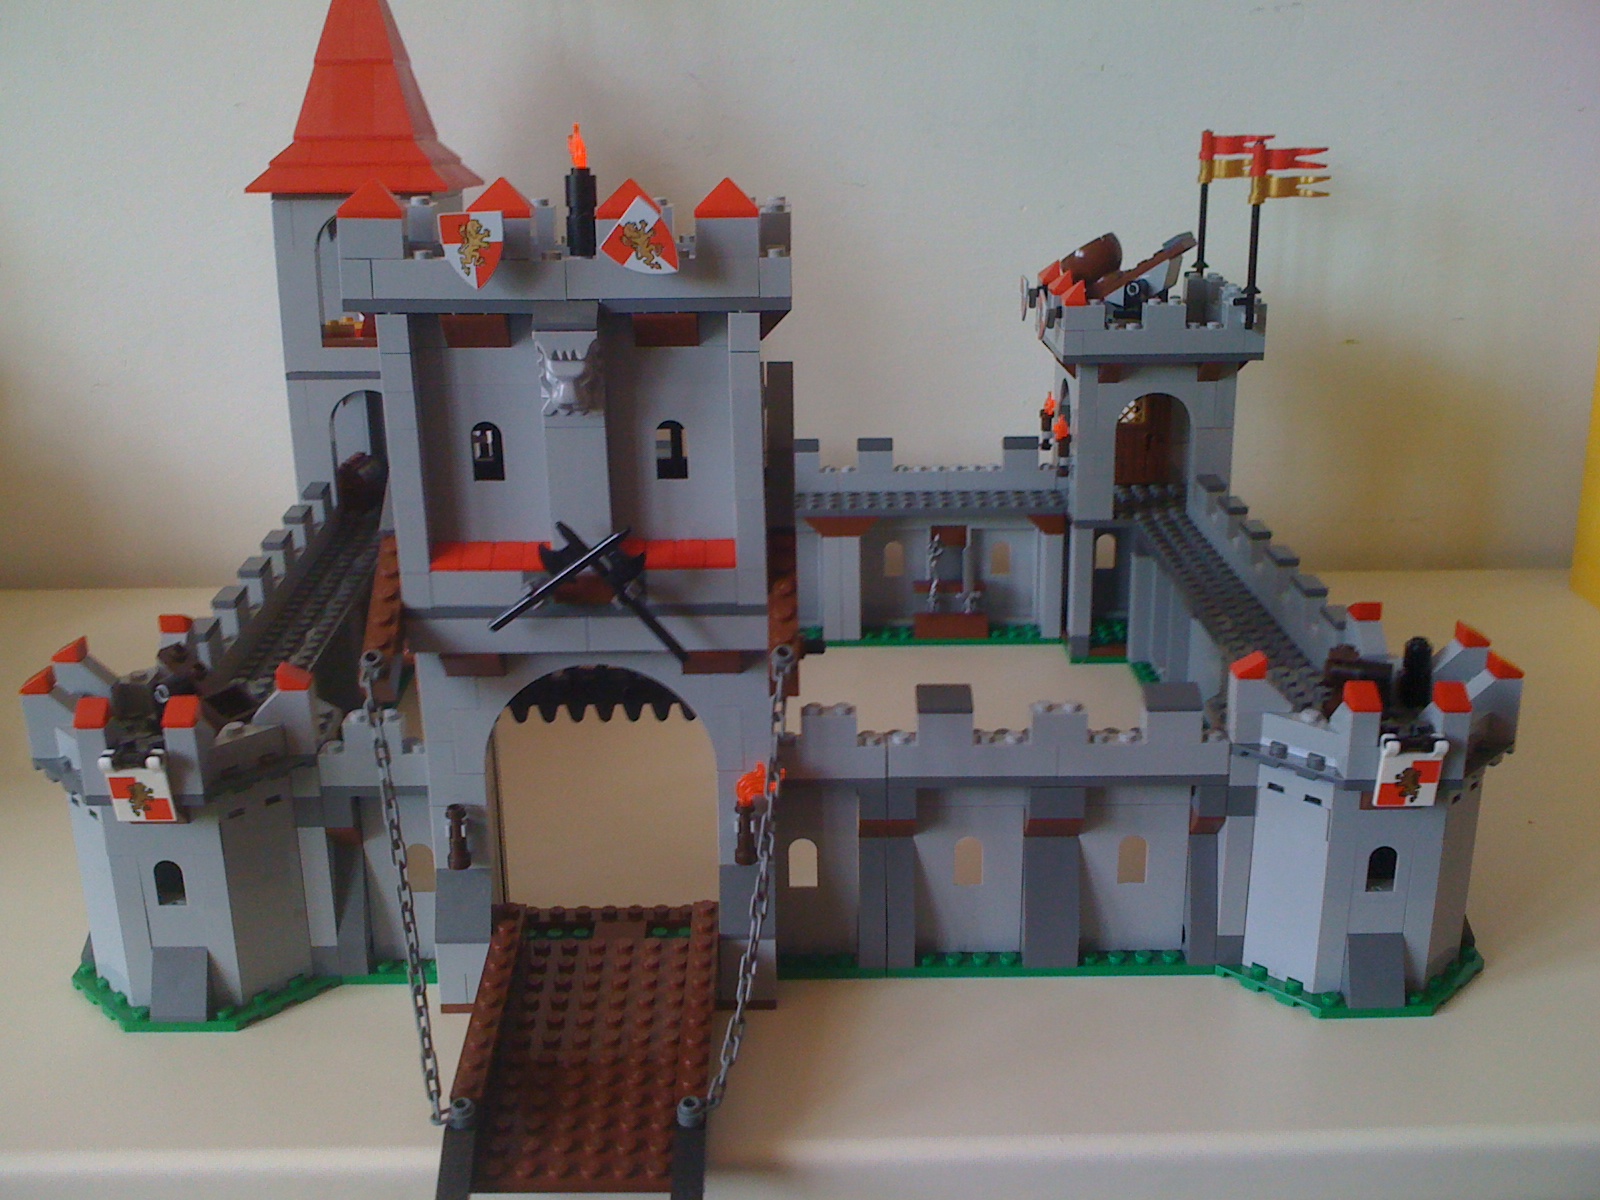
Lego Castello giocabile – Playable Castle
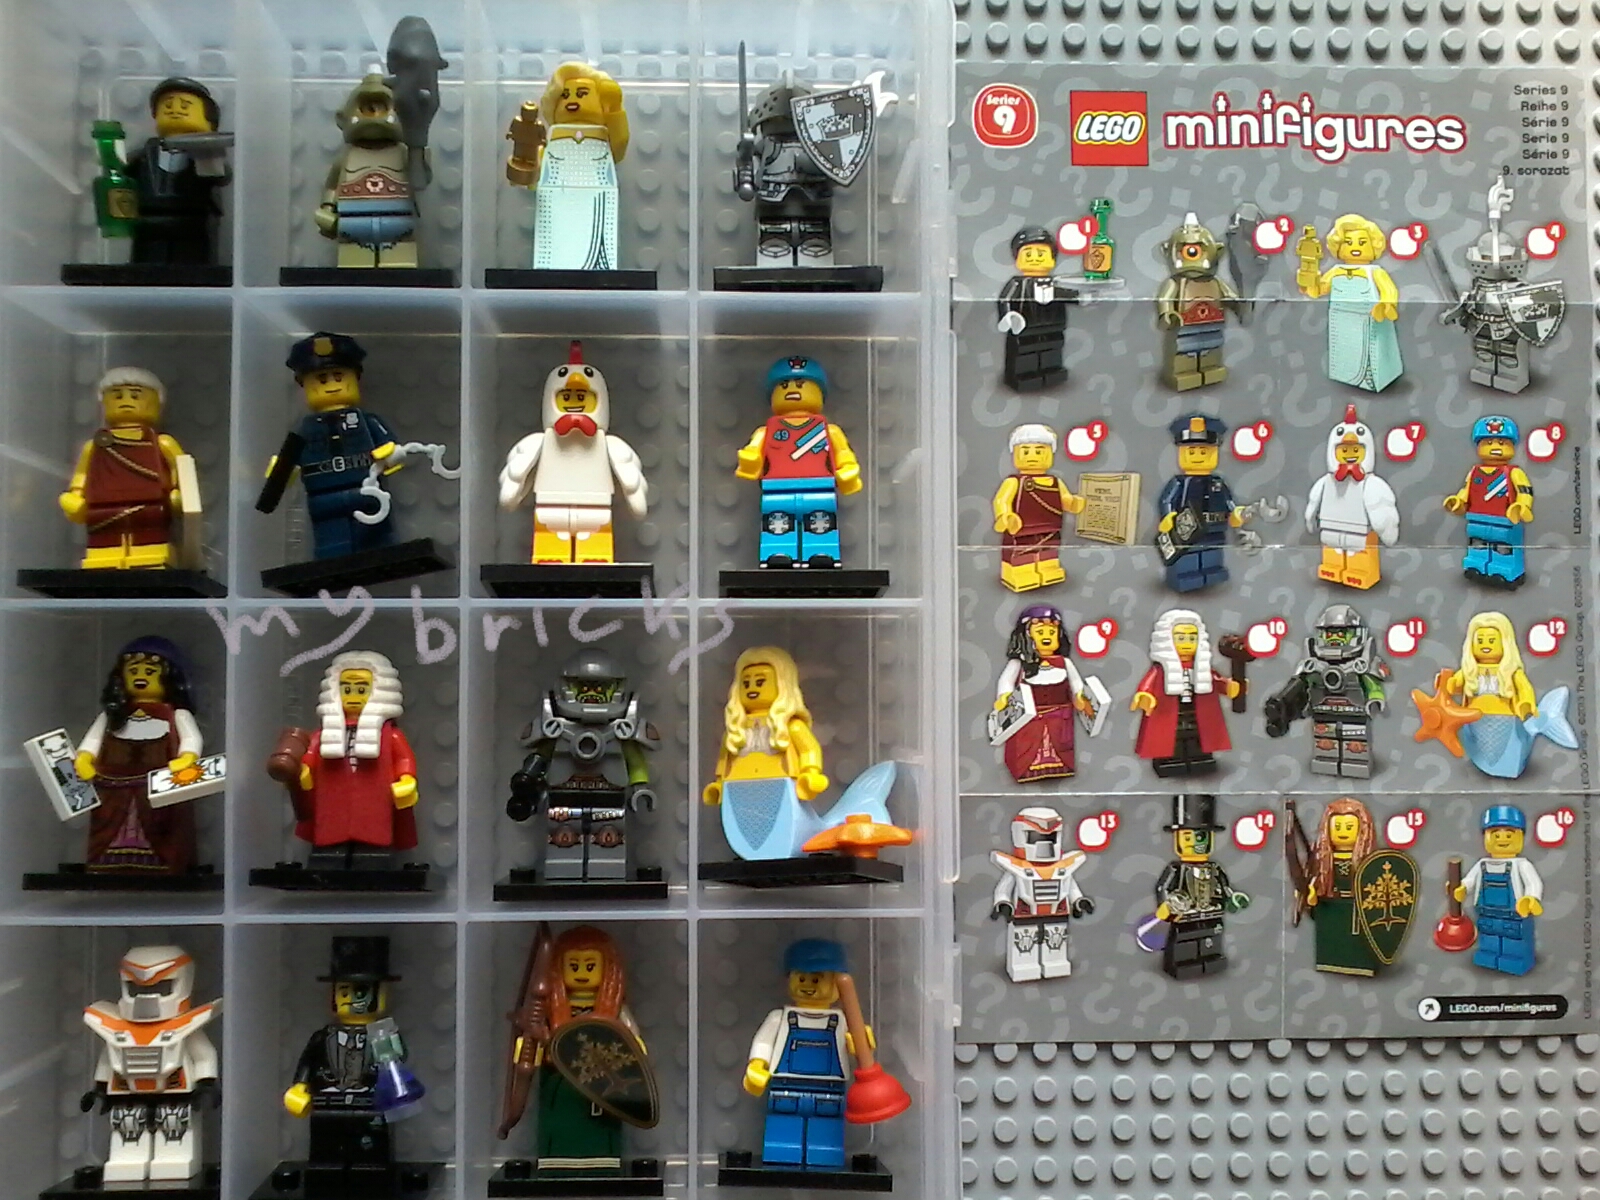
Lego 71000 Minifigures Serie 9 – Collectibles Series Lego January 2013

Lego 8833 Minifigures Serie 8 – Collectibles Series Lego November 2012

Lego 8831 Minifigures Serie 7 – Collectibles Series Lego July 2012

Lego Forza Pescara!
Forza Sansovini!
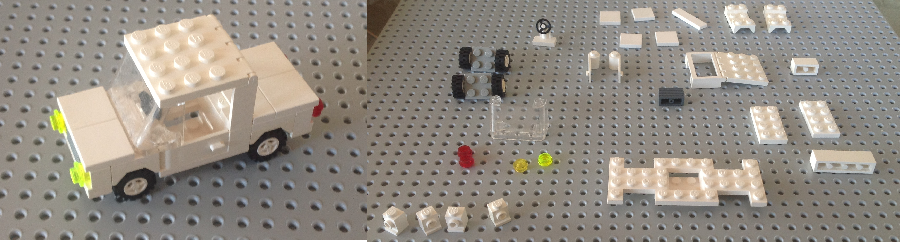
Macchinina Lego – Playable car
Con questo articolo vediamo i pezzi e le istruzioni per costruire una macchinina Lego. Per costruirla ho usato pezzi bianchi, ma il colore ovviamente è lasciato al vostro gusto (ed alle disponibilità di pezzi). Vediamoli ingranditi nella foto seguente. Continue reading

Lego 8827 Minifigures Serie 6 – Collectibles Series Lego March 2012

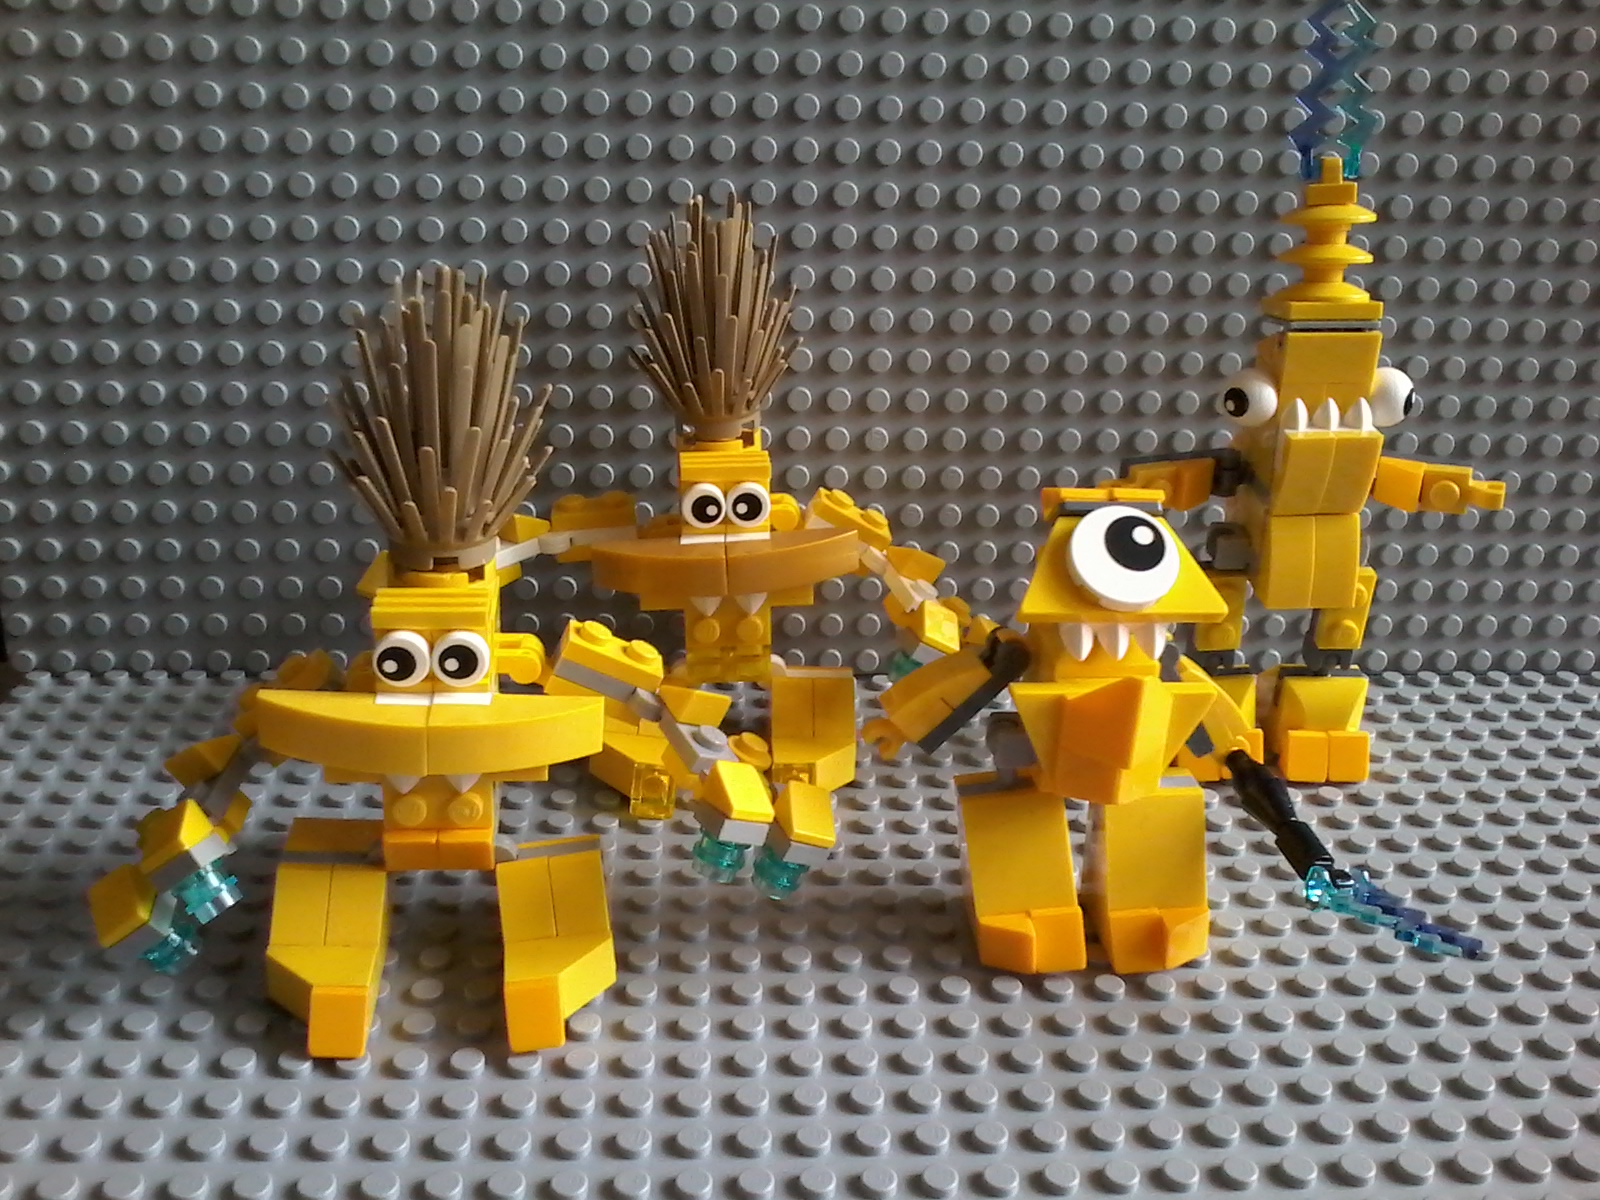
L’esercito degli scheletri Lego – Skeleton’s Army
Un nutrito esercito al seguito del Signore degli scheletri sta marciando a ranghi compatti attraverso il deserto verso il castello.

Lego Scatolina – Custom Box – Dalla scatola per la colazione a un portaoggetti originale! – Custom Box constructed with a common breakfast box!

Lego 8805 Minifigures Serie 5 – Collectibles Series Lego July 2011

Lego 8078 Portale di Atlantis – Portal of Atlantis

Lego Goldrake

Lego 8804 Minifigures Serie 4 – Collectibles Series Lego May 2011

Lego 8803 Minifigures Serie 3 – Collectibles Series Lego February 2011

Lego Cartolina di Natale Christmas Card

Lego 8684 Minifigures Serie 2 – Collectibles Series
Lego December 2010
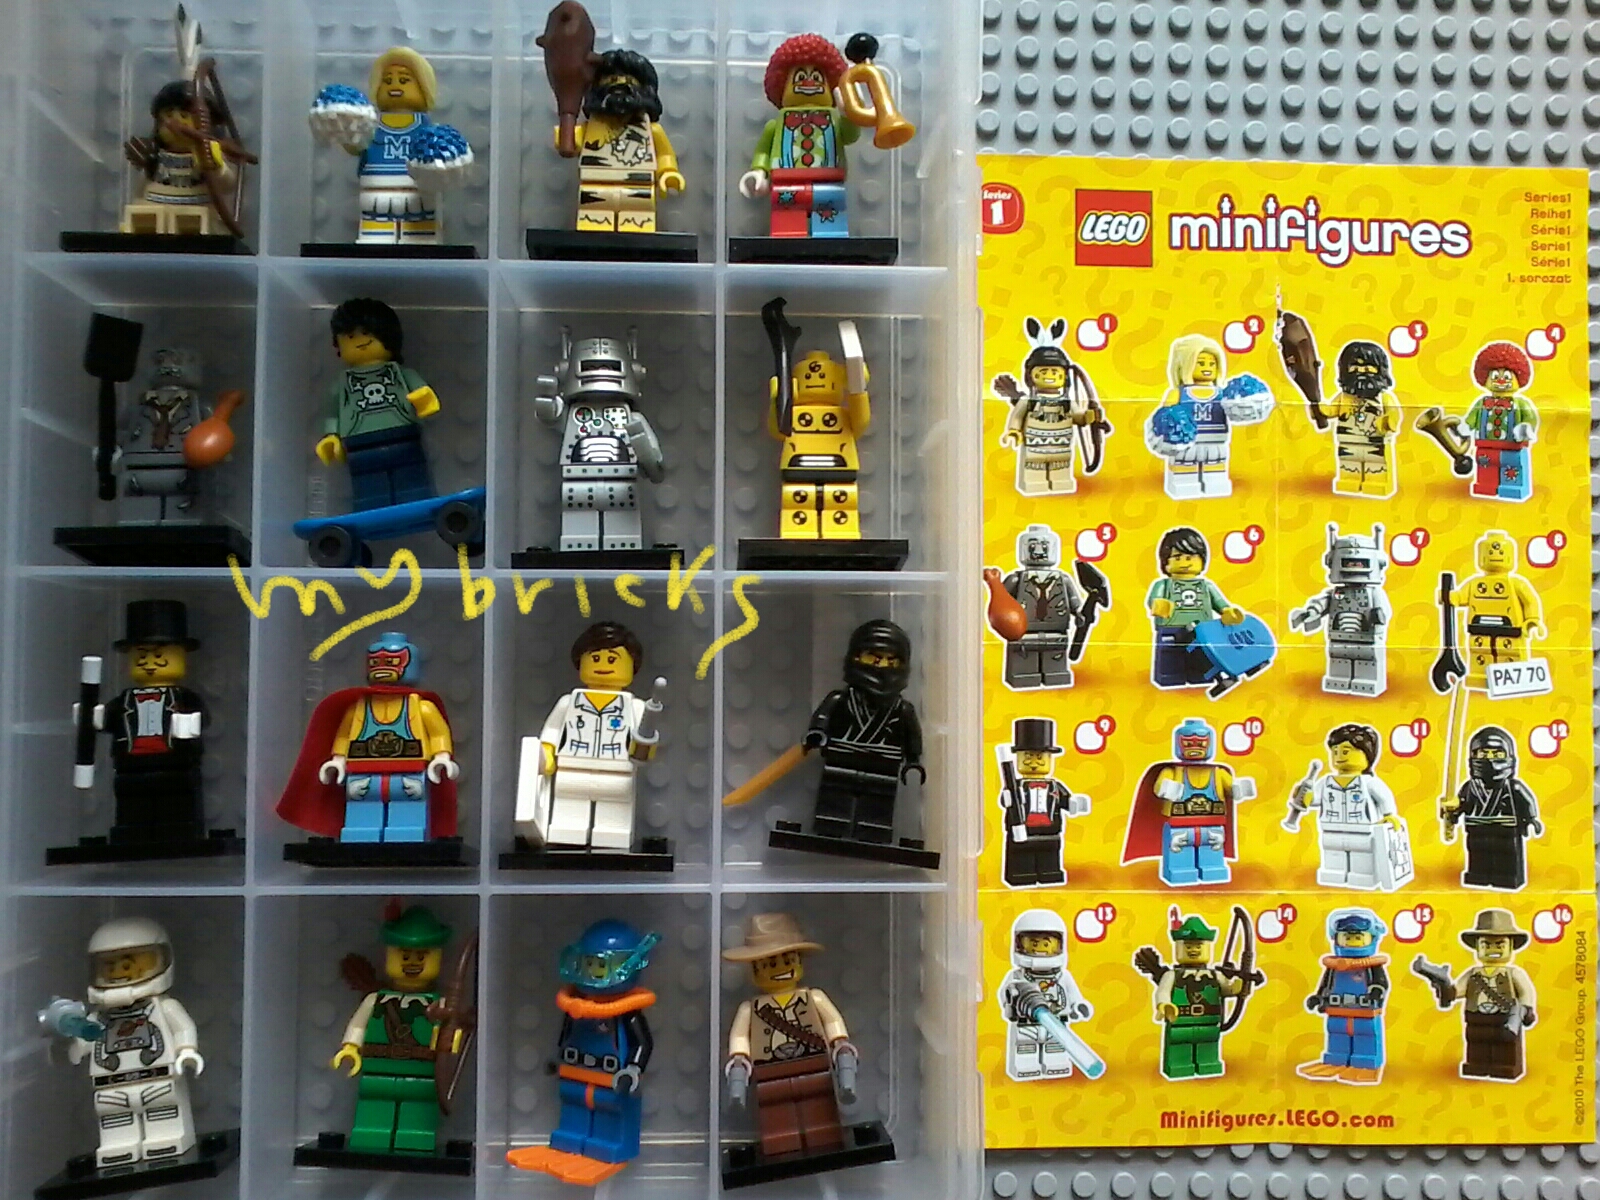
Lego 8683 Minifigures Serie 1 – Collectibles Series
Lego June 2010

Lego Stadio – Stadium
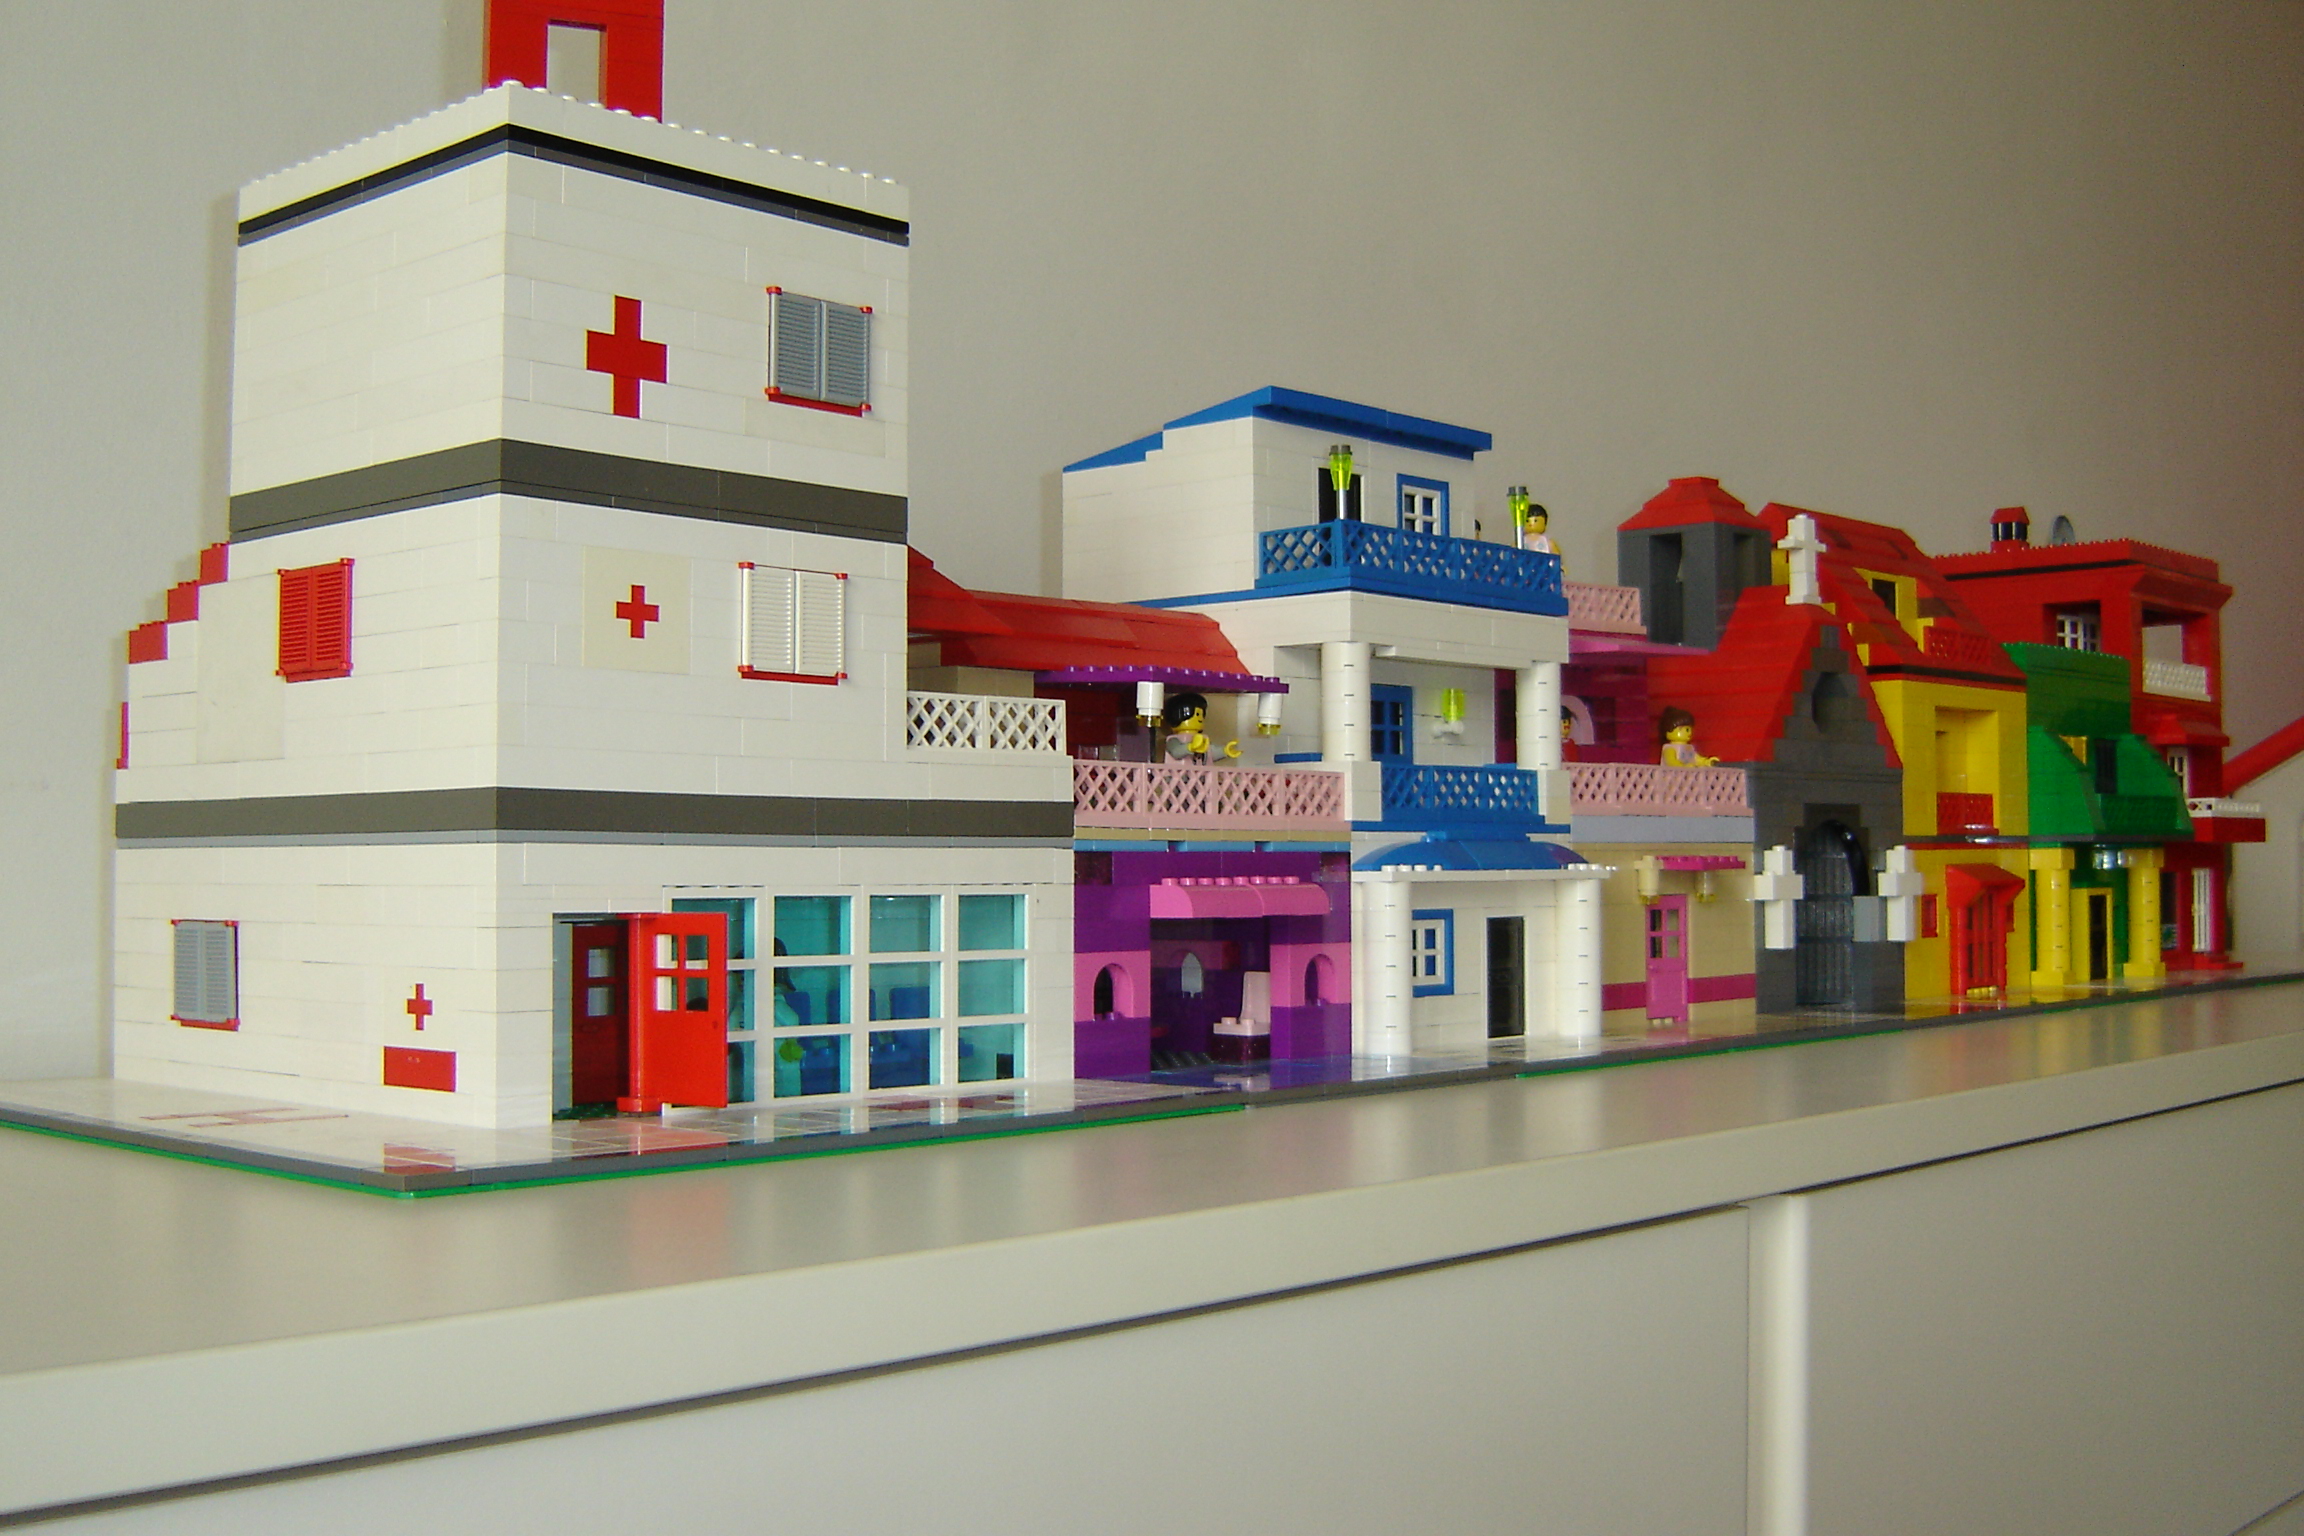
Lego Citta’ a Moduli – City Modules
Lego McDonald’s Promotional – Year 1999
Set # 1 – Lego 2032 – Ronald – 18 pcs
Set # 2 – Lego 2069 – Sunday – 15 pcs
Set # 3 – Lego 2075 – Birdie – 14 pcs
Set # 4 – Lego 1995 -Chicken mc nuggets – 11 pcs
Set # 5 – Lego 2045 – Grimace – 13 pcs
Ser # 6 – Lego 2019 – Fry guy – 13 pcs
Set # 7 – Lego 1841 – Hamburglar – 13 pcs
Set # 8 – Lego 2025 – Fry girl – 12 pcs